Download
1 / 40
400 likes | 419 Views
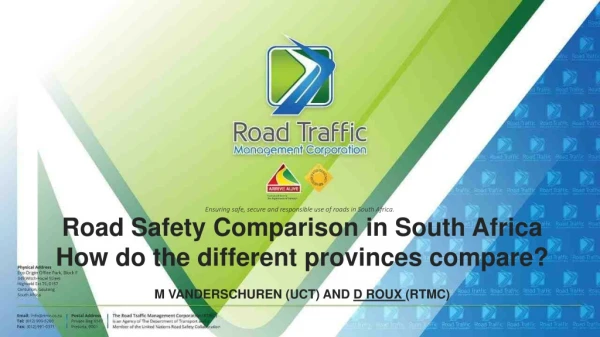
Explore road safety challenges and factors contributing to fatalities in South African provinces. Identify focus areas for tailored interventions.

E N D
Road Safety Comparison in South Africa How do the different provinces compare?M VANDERSCHUREN (UCT) AND D ROUX (RTMC)
Content • Purpose • Problem Statement • Challenges / Limitations • Introduction • Methodology • Analysis and Findings • Conclusions
Purpose To determine the road safety burden faced within provinces in South Africa and from limited data, provide proposed focus areas for tailor-made road safety interventions per province
Problem Statement The success to reduce the fatality numbers varies around the country. This has implications for the associated risk, creating a need for appropriate tailor-made interventions for each province.
Challenges / Limitations • Only Fatal Crash Data • Crashes not recorded spatially accurate • Vehicle Kilometres Travelled • 2015 – 2017 data Fatalities not linked to vehicle • Underreporting • Data completeness e.g. Age
Europe Eastern Mediterranean Introduction Americas South East Asia World Africa Western Pacific Africa
Introduction …continued(2) • Vehicle population ever increasing, especially in middle and low income countries • African & Eastern Mediterranean with large proportion of road users pedestrians • Could be argued that pedestrian fatalities are expected to increase in these regions
South Africa? Introduction …continued(3) ‘WHO 2018’ Groups Group 1: Countries/areas with good death registration data Group 2: Countries with other sources of cause of death information Group 3: Countries with populations less than 150000 Group 4: Countries without eligible death registration data Income level Low | middle | high
Introduction …continued(4) Where does South Africa feature in WHO 2018 Analysis? SA compared to All 175 Countries / Areas Analysed South Africa Fatalities per 100 000 population or the relative risk of dying, due to road crashes 2016 = 25.9 31.9 fatalities per 100 000 in 2010 (Peden et al., 2013)
Introduction …continued(5) Compared to 98 ‘Middle Income’ Countries / Areas Analysed
Introduction …continued(6) Compared to 84 ‘Group 1’ Countries / Areas Analysed ‘Countries/areas with good death registration data’
Introduction …continued(7) Where does South Africa feature within Africa?
Introduction …continued(8) Where does South Africa feature within Africa? Group 1/ Middle Income Countries in the African Region
Culpable Homicide Crash: Observation Report (CHoCOR) Form Methodology SAPS 2015-2017
Methodology …continued(2) Absolute fatalities and fatalities per 100 000 population, are compared The analysis interrogates the influence that aspects, such as age, gender, road user, modal split, day of the week and time of day, have on road fatalities The road safety status quo, for each of the nine provinces in South Africa, is determined and compared in line with the fatality rate per 100 000 population to compare the relative risk of dying, due to road crashes (WHO, 2018)
Methodology …continued(3) Riskfor each age group is further deduced, based on percentage fatalities per time of the day Overall analysis is performed to determine whether males or females are at more risk Synthesis of findings was classified into seven areas for analysis per province: road fatalities per province road fatalities per road user road fatalities per mode of transport road fatalities and gender road fatalities and age and road fatalities and time of day
Road Fatalities per Province (2015-2017) In absolute terms, Gauteng and KwaZulu-Natal most fatalities 2015-2017 Gauteng: 2 472 to 2 800 fatalities | KZN: 2 411 to 2 734fatalities however
Road Fatalities per Province Road crashes cost burden to SA economy R172 billion in 2017 (CPI) Costs related to population size
Road Fatalities per Age 20-40Yrs 28.7% 40-65Yrs 21.8% Age Distribution per province within Age Groups do not vary significantly
Road Fatalities per Age Age Unknown 24.7% Poor follow-up by the SAPS in establishing and submitting victim ages after crash Only 75.3% of fatality ages known, micro-analysis of road fatalities versus age - severe limitations.
Road Fatalities per Gender ‘major gender split’ ‘Small variation between provinces
Road Fatalities per 100 000 Population (M/F) Fatality Rates / 100 000 differences between provinces Gender split for active driver’s licenses (NaTIS) 37.0% Female 63.0% Male Fatal crashes with male/female split could, not be determined from the available data Need to be addressed
Road Fatalities per Road User Type 37.6% - 38.0% 5,337 – 4,870
Road Fatalities per Road User Type significant differences in the road user fatalities per province
Percentage Pedestrian Fatal Crashes per Province Thus, in SA (2017) one or more pedestrian killed in 45.8% of all fatal crashes KZN 55.3% GP 52.4% error in paper SA 2017 45.8% FS 33.8% NC 31.5%
Fatal Crashes per Transport Mode per Province Private Type Vehicle PT LDV HV ? 48,5% 10,1% 19,9% 8,5% 12,8%
% Over and Under Represented – Transport Mode Vehicle Type Distribution for Self-Propelled vehicles within the study period (NaTIS, December 2017) vs Fatal Crashes per Transport Mode LDV Type Vehicles Private Type Vehicles Over Under Heavy Vehicles Public Transport Vehicles
Road Fatalities per Age Group per Day of the Week 47.6% of all Fatalities Sat & Sun 26,4%
Road Fatalities and Month of Year Peak in School Holiday Periods + Easter Age 0-19 Dec 5,6%
Road Fatalities and Time of Day Age 0-19 17:00 – 21:00 14,6% High number of fatalities from 18:00 to 23:00 after-hour activities, alcohol consumption especially over weekends, Speed/reckless level of enforcement
Conclusions • Although South Africa has good road safety data and the country has been able to reduce absolute, as well as relative fatality rates, further action is required. • On average (2015-2017) 25.9 fatalities per 100 000 population occur every year. • Fatalities per 100 000 population vary substantially amongst provinces. • Gauteng & Western Cape fatality rates around 18 fatalities per 100 000 population. • Northern Cape, Mpumalanga and Free State rates close to 35 fatalities per 100 000 Pop. • Fatalities per age group do not significantly differ per province. • Citizens between 20-39 years highest % fatalities (38.7%), followed by the age group between 40-65 years (21.8%).
Conclusions ….continued (2) • Large differences between gender-related fatalities were identified. • Males account for 76.2%of all fatalities. • Fatality rates per 100 000 pop. high for males in MP (45.1), NC (44.6) and the FS (42.7). • NC (13.8) and FS (13.4) fatality rates for females higher than SA average. • Pedestrians most vulnerable road users globally - more so in Africa. • Africa pedestrians account for 40% of all fatalities. SA pedestrian fatalities 38%. • KZN, GP and the WC highest pedestrian fatalities in SA, >50% of fatal crashes 1 or more pedestrian killed.
Conclusions ….continued (3) • Some provinces can be strategic regarding the gender, road users, modes of transport and behaviour they focus on. • NW and GP should address data completeness, i.e. reduce missing data for age, for example. • The following proposed focus areas for tailor made interventions per province, so derived from limited data could provide strategic road safety efforts within each province towards safer roads in SA.
Proposed Focus Areas for Tailor-Made Interventions per Province