Download
1 / 15
150 likes | 273 Views
This presentation provides an overview of the Quality Enhancement Plan (QEP) performance update from Fall 2013 to Spring 2014, highlighting professional development with 9 sessions and 177 participants. It includes statistics on research productivity, classroom usage, critical thinking mastery, and course outcomes. Significant improvements are noted in critical thinking skills, collaboration scores, and final grades in QEP courses compared to non-QEP courses, revealing the effectiveness of team-based learning strategies.

E N D
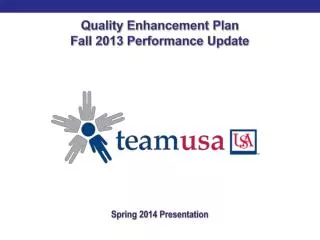
Quality Enhancement Plan Fall 2013 Performance Update Spring 2014 Presentation
Project Overview Professional Development • 9 sessions, 177 participants (F) • 10 in progress (S) Research Productivity • 2012—2 (Refereed Presentations) 1 Invited Keynote • 2013—9 (Refereed Presentations) 1 Invited Keynote • 2014—1 (Refereed Presentation) 1 Invited Keynote;1 invited conference session Participating Instructors • 49 (F) • 55 (S) QEP Classes • 67 (F) • 71 (S) Students Enrolled • 1513 (F) • 1844 (S) Grant Proposals • 1 (SU) (partially funded) • 1 (F) (Under review) • 1 (SP) (Under development) TEAM USA Classroom Usage • 33 hrs per wk (F) • 31 hrs per wk (S)
Findings • 82% of SLO Critical Thinking Mastery Targets were met
Critical Thinking—SLO Target Mastery Report n=233 n=535 n=58 n=51 n=1969 n=445 n=302 n=499 n=103 n=633 45 100-600 level sections
Critical Thinking—California Critical Thinking Skills Test Comparing QEP students with non-QEP students….. • Higher percentile score • A statistically significant difference in all critical thinking constructs--Induction, Deduction, Analysis, Inference, Evaluation, Interpretation and Explanation
Critical Thinking—California Critical Thinking Skills Test Percentile n=52 n=49
Critical Thinking/Collaboration—Pre/Post Critical Thinking/Collaboration Test • Higher post-test scores • A statistically significant difference pertaining to evaluating, analyzing, creating and collaboration as compared to pre-test scores
Critical Thinking—Pre/Post Test Critical Thinking 2.7% n=718 n=699
Collaboration—Pre/Post Test Collaboration 5.3% n=718 n=699
Final Grades Comparing QEP students with non-QEP students….. • More A’s and B’s and fewer D’s and F’s in QEP courses as compared to non-QEP courses • A statistically significant difference in student grades
Final Grades # of Students 50% 48% 24% 36% 11% 15% 7% 4% 3% 2% 100-600 level sections QEP NON-QEP QEP n=1489 Non-QEP n=1089
Persistence—Course Withdrawal Rates Comparing QEP students with non-QEP students….. • 50% fewer student withdrawals from QEP courses • Astatistically significant difference in persistence
Persistence—Course Withdrawal Rate (100-400 Level) 39sections 35 sections
What is Team-Based Learning? Team Based Learning is a collaborative learning strategy including the following instructional components: • In-Class Application Activities: Application of content using based on 4 S’s Significant problem Same problem Specific choice Simultaneous reporting • Peer Evaluation: Team members evaluate each other’s performance • Readiness Assurance: Application does not begin until students have mastered content as evidenced by “iRAT” and “tRAT” assessments • Strategically Formed Teams purposefully designed Teams: