
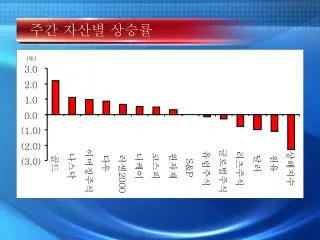
주간 자산별 상승률
(%). 3.0. 2.0. 1.0. 0.0. (1.0). (2.0). (3.0). 골드. 다우. 달러. 원유. 나스닥. 니케이. 코스피. 원자재. S&P. 유럽주식. 리츠주식. 상해지수. 이머징주식. 글로벌주식. 러셀 2000. 주간 자산별 상승률. 양적완화 정책 , 금값 상승 가속화. ( 달러 / 온스 ). 미국 양적완화 예상 ?. 1350 1300 1250 1200 1150 1150 1100 1050 1000. 골드. 일본 양적완화. 유럽 양적완화.

주간 자산별 상승률
E N D
Presentation Transcript
(%) 3.0 2.0 1.0 0.0 (1.0) (2.0) (3.0) 골드 다우 달러 원유 나스닥 니케이 코스피 원자재 S&P 유럽주식 리츠주식 상해지수 이머징주식 글로벌주식 러셀2000 주간 자산별 상승률
양적완화 정책, 금값 상승 가속화 (달러/온스) 미국 양적완화 예상? 1350 1300 1250 1200 1150 1150 1100 1050 1000 골드 일본 양적완화 유럽 양적완화 1월 3월 5월 7월 9월
5 1 46 48 Global 주식 Global 채권 대안자산 금 글로벌 펀드 자산 배분 편입 비중
(Gold/자산) 18 현재 평균 16 14 12 10 8 6 4 2 0 S&P500 MSCI World ex Crude Oil US 주요 자산 vs 금 가격
(Gold/자산) 18 현재 평균 16 14 12 10 8 6 4 2 0 S&P500 MSCI World ex Crude Oil US 주요 자산 vs 금 가격
(Gold/자산) 18 현재 평균 16 14 12 10 8 6 4 2 0 S&P500 MSCI World ex Crude Oil US 주요 자산 vs 금 가격
(Gold/자산) 18 현재 평균 16 14 12 10 8 6 4 2 0 S&P500 MSCI World ex Crude Oil US 주요 자산 vs 금 가격