
EXAMPLE 1
E N D
Presentation Transcript
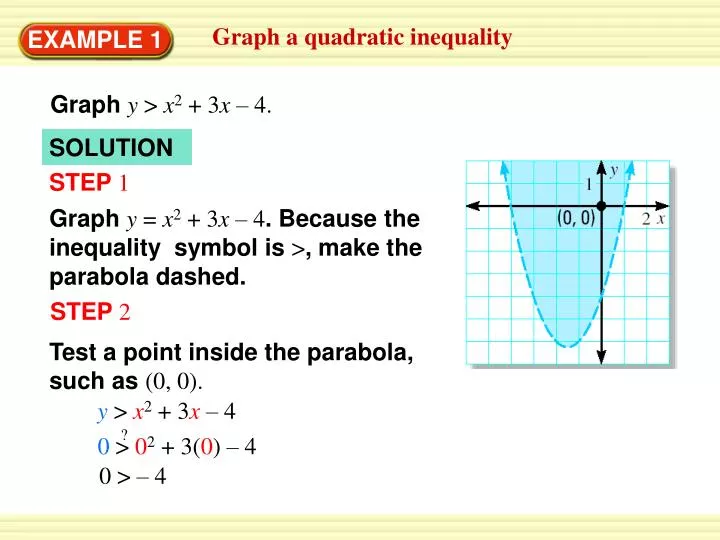
? 0> 02 + 3(0)– 4 Graph a quadratic inequality EXAMPLE 1 Graph y > x2 + 3x – 4. SOLUTION STEP 1 Graph y = x2 + 3x – 4. Because the inequality symbol is >, make the parabola dashed. STEP 2 Test a point inside the parabola, such as (0, 0). y> x2 + 3x– 4 0 > – 4
Graph a quadratic inequality EXAMPLE 1 So, (0, 0) is a solution of the inequality. STEP 3 Shade the region inside the parabola.
Use a quadratic inequality in real life EXAMPLE 2 Rappelling A manila rope used for rappelling down a cliff can safely support a weight W(in pounds) provided W ≤ 1480d2 where dis the rope’s diameter (in inches). Graph the inequality. SOLUTION Graph W = 1480d2 for nonnegative values of d. Because the inequality symbol is ≤, make the parabola solid. Test a point inside the parabola, such as (1, 2000).
2000 ≤ 1480 Use a quadratic inequality in real life EXAMPLE 2 W≤ 1480d2 2000≤ 1480(1)2 Because (1, 2000) is not a solution, shade the region below the parabola.
Graph a system of quadratic inequalities EXAMPLE 3 Graph the system of quadratic inequalities. y < – x2 + 4 Inequality 1 y > x2 – 2x – 3 Inequality 2 SOLUTION STEP 1 Graph y ≤ –x2 + 4. The graph is the red region inside and including the parabola y = –x2 + 4.
Graph a system of quadratic inequalities EXAMPLE 3 STEP 2 Graph y > x2– 2x – 3. The graph is the blue region inside (but not including) the parabola y = x2 –2x – 3. STEP 3 Identify the purple regionwhere the two graphs overlap. This region is the graph of the system.
? 0> 02 + 2(0)– 8 for Examples 1, 2, and 3 GUIDED PRACTICE Graph the inequality. y > x2 + 2x – 8 STEP 1 Graph y = x2 + 2x – 8. Because the inequality symbol is >, make the parabola dashed. STEP 2 Test a point inside the parabola, such as (0, 0). y> x2 + 2x– 8 0 > – 4
for Examples 1, 2, and 3 GUIDED PRACTICE So, (0, 0) is a solution of the inequality. STEP 3 Shade the region inside the parabola.
? 0< 02 – 3(0)+ 1 for Examples 1, 2, and 3 GUIDED PRACTICE Graph the inequality. y < 2x2 – 3x + 1 SOLUTION STEP 1 Graph y = 2x2 – 3x + 1. Because the inequality symbol is <, make the parabola dashed. STEP 2 Test a point inside the parabola, such as (0, 0). y< 2x2 – 3x+ 1 0 < 1
for Examples 1, 2, and 3 GUIDED PRACTICE So, (0, 0) is a solution of the inequality. STEP 3 Shade the region inside the parabola.
? 0< 02 + 4(0)+ 2 for Examples 1, 2, and 3 GUIDED PRACTICE Graph the inequality. y < – x2 + 4x + 2 SOLUTION STEP 1 Graph y = – x2 + 4x + 2. Because the inequality symbol is <, make the parabola dashed. STEP 2 Test a point inside the parabola, such as (0, 0). y< – x2 + 4x+ 2 0 < 2
for Examples 1, 2, and 3 GUIDED PRACTICE So, (0, 0) is a solution of the inequality. STEP 3 Shade the region inside the parabola.
for Examples 1, 2, and 3 GUIDED PRACTICE Graph the system of inequalities consisting of y ≥ x2andy < 2x2 + 5. SOLUTION STEP 1 Graph y > x2. – STEP 2 Graph y < 2x2 + 5. STEP 3 Identify the shaded regionwhere the two graphs overlap. This region is the graph of the system.


