Download
1 / 15
160 likes | 263 Views
Learn the fundamentals of Feynman diagrams, their origin from Minkowski diagrams, and step-by-step instructions to create and understand particle transitions in this graphical form. Practice with neutron-proton and electron-neutrino collisions.

E N D
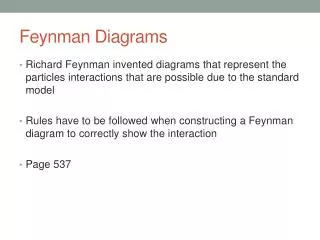
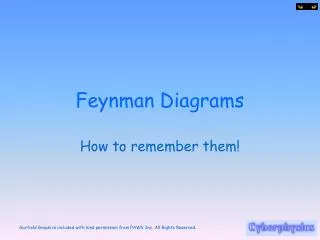
Feynman Diagrams How to remember them!
What do they represent? • Particle transitions in a diagrammatic form • Originally they were taken from graphs of events described on a ct (Y axis) vs. x (X axis) graph called a Minkowski Diagram • ct (is basically displacement – velocity x time) • So the diagrams are a corruption of a displacement / displacement graph of a particle event.
First Step • Consider the equation of the interaction that you are going to turn into a Feynman diagram. • It MUST balance!
Beta decay • A neutron changes into a proton and a beta particle (GCSE knowledge) • Looking at the equation we see that • Charge balances • Baryon number balances BUT • Lepton number does NOT balance • Therefore we need an uncharged (so we don’t interfere with charge balance!) anti-lepton to complete the reaction…. An anti-neutrino.
Second Step • Draw the diagram • Start with the proton or neutron and put an arrow from it changing it into its counterpart – all of the Feynman diagrams you have to do have this transition in them!)
Drawing the diagram • From the junction of the two baryon forms put a wavy line to represent the exchange particle. • This is the w-boson (weak nuclear force reaction of a proton/neutron change – or u/d quark change)
Drawing the diagram • Fill in the products of the interchange • If it is simply a decay the two other products are going away from the boson… • If it is an interaction of a particle with the baryon, that particle will go towards the other end of the exchange particle…. and the products will go away from it.
Drawing the diagram • Look to the charge and the direction it goes for the sign and arrow on the boson – each vertex must balance. • The charge that goes into the vertex (arrows towards the vertex) MUST equal the charge that comes out of it (arrows going away from the vertex).
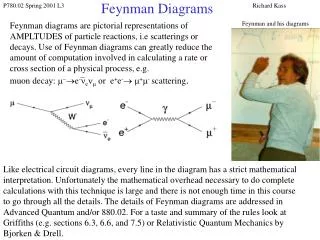
The diagram Following the arrows indicates the order in which transitions occur. Time direction is indicated by the arrows NOT direction direction. The neutron becomes a proton – at that instant a w- boson exchange particle is produced. This a split second later becomes an electron and an antineutrino. The arrow on the w- boson shows the direction that the negative charge is taken in. Each vertex balances – charge in = charge out. This will help you decide on the direction and sign of the w-boson
The diagram Each vertex balances – charge in = charge out. This will help you decide on the direction and sign of the w-boson Positive charge and negative charge go away from the first vertex and a neutral goes in – so they balance! Negative and neutral go out and negative goes into the second vertex – so they balance!
Practice • Try the electron-proton collision:
Practice • Try the neutrino-neutron collision