Download
1 / 7
70 likes | 197 Views
StatPlanet data v isualization Communicating information for decision making. Frank van Cappelle IIEP/UNESCO. www.sacmeq.org/statplanet. Each stripe signifies a death. John Snow’s map of Cholera outbreak in London. 1854. What percentage of schools have an emergency plan for floods?.

E N D
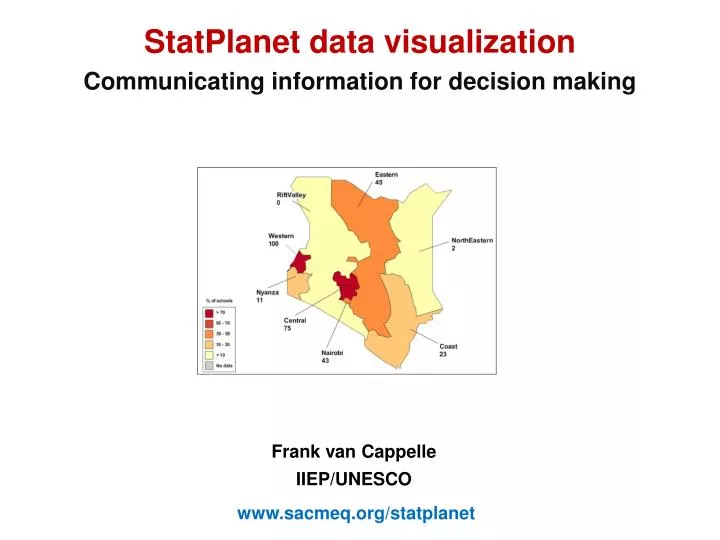
StatPlanet data visualization Communicating information for decision making Frank van Cappelle IIEP/UNESCO www.sacmeq.org/statplanet
Each stripe signifies a death John Snow’s map of Cholera outbreak in London 1854
What percentage of schools have an emergency plan for floods? ?
What percentage of schools have an emergency plan for floods? ?
StatPlanetCharacteristics • Free • Easy to use • Usable in places with limited resources (Does not require Internet, a modern PC, or additional software) • Easy to distribute(As big as a PDF or Word file, no installation required) • Adding your own data is easy & fast(Data importing and visualization are automated) www.sacmeq.org/statplanet