Download
1 / 93
930 likes | 1.1k Views
Changes matter more than states. People’s preferences are especially sensitive to changes. Suppose you are asked two questions:

E N D
Changes matter more than states. People’s preferences are especially sensitive to changes. Suppose you are asked two questions: A: Imagine then you are richer by Euro 20,000 than you are today. Would you prefer an additional gain of 5,000 for sure or a 50–50 chance for a gain of 10,000? Make one choice. B: Imagine then you are richer by Euro 30,000 than you are today. Would you prefer an additional loss of 5,000 for sure or a 50–50 chance for a loss of 10,000? Make one choice. Distortions In Deriving Preferences 1 Thursday, 07 August 20143:21 PM
Although the final outcomes in the two problems are exactly the same, most people choose the gamble in Question A and the sure loss in Question B. Apparently, they tend to favour the narrow framing based on gains and losses rather than the broader (and more relevant) framing based on the final wealth. Distortions In Deriving Preferences 2
People’s sensitivity to losses is higher than their sensitivity to gains. Suppose you are asked the question: Consider a bet on the toss of the coin. If heads, you lose Euro 100. What is the minimum gain, if tails, that would make you accept the gamble? Most answers typically fall in the range from 200 to 250, which reflects a sharp asymmetry between the values that people attach to gains and loses. Distortions In Deriving Preferences - Loss Aversion 3
One ubiquitous pattern stands out: Losses resonate more than gains. In a wide variety of domains, people are more averse to losses than they are attracted to same-sized gains. One of the main realms where loss aversion plays out is in preferences over wealth levels. Distortions In Deriving Preferences - Loss Aversion 4
What distinguishes loss aversion from conventional risk aversion is that people are significantly "risk averse" for even small amounts of money. People dislike losing $10 more than they like gaining $11, and hence prefer their status quo to a 50/50 bet of losing $10 or gaining $11. Tversky and Kahneman (1991) suggest that in most domains where sizes of losses and gains can be measured, people value moderate losses roughly twice as much as equal-sized gains. Distortions In Deriving Preferences - Loss Aversion 5
Finally, in prospect theory (which is a key concept in behavioural economics), the pain associated with a possible loss is much greater than the pleasure associated with a gain of the same magnitude. In the strip, Dilbert's garbage man clearly understands this concept much better than Dilbert. Cartoon(Kramer 2014) Distortions In Deriving Preferences - Loss Aversion 6
Women are found to be more risk averse in making financial decisions than men (Donkers and Van Soest, 1999; Powell and Ansic, 1997; Weber et al., 2002). Women also tend to own less risky assets than single men or married couples and reduce their risky assets when the number of children increases, in contrast to single men and married couples (Jianakoplos and Bernasek, 1998). Furthermore, older people tend to take less financial risks than younger people (Jianakoplos and Bernasek, 2006). Distortions In Deriving Preferences - Risk Aversion 7
On the other hand, it has been shown that effective risk diversification was possible to teach (Hedesström et al., 2006). “In 4 experiments, undergraduates made hypothetical investment choices. … In order to counteract naive diversification, novice investors need to be better informed about the rationale underlying recommendations to diversify.” Distortions In Deriving Preferences - Risk Aversion 8
People’s financial history has a strong impact on their taste for risk. Malmendier and Nagel (2011) investigated whether individual experiences of macroeconomic shocks affect financial risk taking. As has often been suggested for the generation that experienced the Great Depression. Using data from the Survey of Consumer Finances from 1960 to 2007, they found that individuals who have experienced low stock market returns throughout their lives so far report lower willingness to take financial risk. They are less likely to participate in the stock market. Invest a lower fraction of their liquid assets in shares if they participate. They are more pessimistic about future share returns. Distortions In Deriving Preferences - Risk Aversion 9
Exposure to economic turmoil appears to dampen people’s appetite for risk irrespective of their personal financial losses. That is the conclusion of Knüpfer et al. (2013) who suggest that labour market experiences are a natural candidate for explaining portfolio heterogeneity. In the early 1990s a severe recession caused Finland’s GDP to sink by 10% and unemployment to soar from 3% to 16%. Using detailed data on tax, unemployment and military conscription, the authors were able to analyse the investment choices of those affected by Finland’s “Great Depression”. Distortions In Deriving Preferences - Risk Aversion 10
The results suggest that workers who have experienced more adverse labour market conditions are significantly less likely to invest in risky assets. The decrease in risky investment is robust to controls for parental variables, family fixed effects, and cognitive ability, and is not fully attributable to the impact labour market shocks have on future income, unemployment risk, and wealth accumulation. They found that those hit harder by unemployment were less likely to own stocks a decade later. Individuals’ personal misfortunes, could explain at most half of the variation in stock ownership. They attribute the remainder to “changes in beliefs and preferences” that are not easily measured. Distortions In Deriving Preferences - Risk Aversion 11
Financial trauma appears to dampen people’s appetite for risk. Guiso et al. (2013) examined the investments of several hundred clients of a large Italian bank in 2007 and again in 2009 (i.e. before and after the plunge in global stock markets). The authors also asked the clients about their attitudes towards risk and got them to play a game modelled on a television show in which they could either pocket a small but guaranteed prize or gamble on winning a bigger one. Distortions In Deriving Preferences - Risk Aversion 12
Risk aversion, by these measures, rose sharply after the crash, even among investors who had suffered no losses in the stock market. They found that both a qualitative and a quantitative measure of risk aversion increases substantially after the crisis. After considering standard explanations, they investigated whether this increase might be an emotional response (fear) triggered by a scary experience. The reaction to the financial crisis, the authors conclude, looked less like a proportionate response to the losses suffered and “more like old-fashioned ‘panic’.” To show the plausibility of this conjecture, they conducted a lab experiment. Distortions In Deriving Preferences - Risk Aversion 13
The authors’ conclusions were reinforced by a separate test administered to a few hundred university students. About half were asked to watch a five-minute excerpt of a gruesome torture scene from a horror film. Then, the entire group answered the same questions about risk as the Italian bank’s clients. Watching the horror movie increased the students’ aversion to risk by roughly as much as the financial crisis had chastened the bank’s clients, although not among those who claimed to like horror movies. They found that subjects who watched a horror movie have a certainty equivalent that is 27% lower than the ones who did not, supporting the fear-based explanation. Distortions In Deriving Preferences - Risk Aversion 14
Previous studies of loss aversion in decisions under risk have led to mixed results. Losses appear to loom larger than gains in some settings, but not in others. The paper (Ert and Erev, 2013) highlighting six experimental manipulations that tend to increase the likelihood of the behaviour predicted by loss aversion. Risk Aversion – A Counter 15
These manipulations include: 1 framing of the safe alternative as the status quo; 2 ensuring that the choice pattern predicted by loss aversion maximizes the probability of positive (rather than zero or negative) outcomes; 3 the use of high nominal (numerical) payoffs; 4 the use of high stakes; 5 the inclusion of highly attractive risky prospects that creates a contrast effect; 6 the use of long experiments in which no feedback is provided and in which the computation of the expected values is difficult. Risk Aversion – A Counter 16
Their results suggest the possibility of learning in the absence of feedback: The tendency to select simple strategies, like “maximize the worst outcome” which implies “loss aversion”, increases when this behaviour is not costly. Theoretical and practical implications are discussed (Ert and Erev, 2013). Risk Aversion – A Counter 17
Loss aversion is related to the striking endowment effect identified by Thaler (1980, 1985). Once a person comes to possess a good, they immediately value it more than before they possessed it. How would you feel if you lost everything you owned, even if you were financially compensated? Like part of you had died? Or liberated? Examine the psychology of our lifelong relationship with objects (Jarrett, 2013). Distortions In Deriving Preferences - Endowment Effect 18
Kahneman et al. (1990) tested the endowment effect in a series of experiments, conducted in a classroom setting. In one of these experiments a decorated mug (retail value of about $5) was placed in front of one third of the seats after students had chosen their places. Distortions In Deriving Preferences - Endowment Effect 19
All participants received a questionnaire. The form given to the recipients of a mug (the “sellers”) indicated “You now own the object in your possession. You have the option of selling it if a price, which will be determined later, is acceptable to you. For each of the possible prices below indicate whether you wish to (x) Sell your object and receive this price; (y) Keep your object and take it home with you.” The subjects indicated their decision for prices ranging from $0.50 to $9.50 in steps of 50 cents. Distortions In Deriving Preferences - Endowment Effect 20
Some of the students who had not received a mug (the “choosers”) were given a similar questionnaire, informing them that they would have the option of receiving either a mug or a sum of money to be determined later. They indicated their preference between a mug and sums of money ranging from $0.50 to $9.50. The choosers and the sellers face precisely the same decision problem, but their reference states differ. Distortions In Deriving Preferences - Endowment Effect 21
The choosers face a positive choice between two options that dominate (their reference state). The sellers must choose between retaining the status quo (the mug) or giving up the mug in exchange for money. Thus, the mug is evaluated as a gain by the choosers, and as a loss by the sellers. Loss aversion entails that the rate of exchange of the mug against money will be different in the two cases. Distortions In Deriving Preferences - Endowment Effect 22
Indeed, the median value of the mug was $7.12 for the sellers and $3.12 for the choosers in one experiment, $7.00 and $3.50 in another. The difference between these values reflects an endowment effect, which is produced, apparently instantaneously, by giving an individual property rights over consumption goods. Distortions In Deriving Preferences - Endowment Effect 23
The behaviour described here is usefully conceptualised as a case of loss aversion comparable to that identified in choice among lotteries. Individuals who are randomly given mugs treat the mug as part of their reference levels or endowments, and consider not having a mug to be a loss, whereas individuals without mugs consider not having a mug as remaining at their reference point. Distortions In Deriving Preferences - Endowment Effect 24
As established by Knetsch and Sinden (1984), Samuelson and Zeckhauser (1988), and Knetsch (1989), a comparable phenomenon - the status quo bias - holds in multiple-goods choice problems. Here, loss aversion implies that an individual's willingness to trade one object for another depends on which object they begin with: Individuals tend to prefer the status quo to changes that involve losses in some dimensions, even when these losses are coupled with gains in other dimensions. Distortions In Deriving Preferences - Status Quo Bias 25
Knetsch and Sinden (1984) and Knetsch (1989), for instance, demonstrated the status quo bias by randomly giving one set of students candy bars, and the remaining students decorated mugs. Later, each student was offered the opportunity to exchange their gift for the other one - a mug for a candy bar or vice versa. 90% of both mug-owners and candy-owners chose not to trade. Distortions In Deriving Preferences - Status Quo Bias 26
Because the goods were allocated randomly and transaction costs were minimal, the different behaviour for the two groups of subjects must have reflected preferences that were induced by the allocation. Distortions In Deriving Preferences - Status Quo Bias 27
Other experiments have shown that the more choices you are given, the more pull the status quo has. More people will, for instance, choose the status quo when there are two alternatives to it rather than one: For example A and B instead of just A. Why? Choosing between A and B requires additional effort; selecting the status quo avoids that effort. In business, where sins of commission (doing something) tend to be punished much more severely than sins of omission (doing nothing), the status quo holds a particularly strong attraction. Distortions In Deriving Preferences - Status Quo Bias 28
A related study by the Office of Fair Trading (2008) examined the psychology of personal current bank account usage, with a focus upon account switching and bank charges. Each year, only a small fraction of people switch current accounts and the overall switching rate is low. Each year, a large proportion of people incur bank charges. Six psychological factors that may affect switching and charge-incurring behaviour were considered. Distortions In Deriving Preferences - Status Quo Bias 29
Key findings include: 1. Interviewees believed that, when switching, payments may be missed and were averse to possible practical losses. The suggestion is that people are not concerned about general financial loss during switching, but more concerned about the inconvenience and hassle of losing features or having to correct missed payments. Distortions In Deriving Preferences - Status Quo Bias 30
Key findings include: 2. However interviewees' perceptions of their control over switching were high, suggesting that, despite problems, they believed that they could switch as long as they had the necessary resources and ability to change and were not limited by outside forces. Distortions In Deriving Preferences - Status Quo Bias 31
Key findings include: 3. Interviewees showed a strong focus on the here-and-now at the expense of a future orientation, and may constantly defer taking action to switch. In order for a person to take action, the expected future gain received will need to be financially much larger than the future consequence. Distortions In Deriving Preferences - Status Quo Bias 32
Key findings include: 4. Interviewees were overconfident in their financial management, and underestimated the likelihood that they would become overdrawn and be charged. This overconfidence means that people probably underestimate the cost of banking and are more optimistic about the cost of banking. This optimism could result from psychological overconfidence in one's own abilities, but it may also result from a failure to correctly identify unpredictable outside consequences that may cause one to become overdrawn. Distortions In Deriving Preferences - Status Quo Bias 33
Key findings include: 5. Interviewees reported spending little time thinking about their finances. Distortions In Deriving Preferences - Status Quo Bias 34
Key findings include: 6. Perceptions of charges showed that, in principle, the existence of charges were not viewed as particularly unfair, with more favourable perceptions associated with increased awareness and advance warning of charges. Distortions In Deriving Preferences - Status Quo Bias 35
The UK's 46 million current account holders will be able to switch banks in seven days from next month. After two years of preparation, the Payments Council has confirmed a new switching service will start on 16 September 2013. Until now, transferring an account to a new provider has taken up to 30 days. In anticipation of the new scheme, two banks are already offering customers an incentive of up to £125 to switch their current accounts to them. Distortions In Deriving Preferences - Status Quo Bias 36
The service is being launched following a recommendation from the Independent Commission on Banking two years ago, which said that people only changed bank accounts once every 26 years on average. BBC News - Bank account switching service to launch in September 16 August 2013 Link Distortions In Deriving Preferences - Status Quo Bias 37
Hammond et al., 2006 1. Always remind yourself of your objectives and examine how they would be served by the status quo. You may find that elements of the current situation act as barriers to your goals. 2. Never think of the status quo as your only alternative. Identify other options and use them as counterbalances, carefully evaluating all the pluses and minuses. 3. Ask yourself whether you would choose the status-quo alternative if, in fact, it weren't the status quo. Status Quo Bias - Avoidance 38
4. Avoid exaggerating the effort or cost involved in switching from the status quo. 5. Remember that the desirability of the status quo will change over time. When comparing alternatives, always evaluate them in terms of the future as well as the present. 6. If you have several alternatives that are superior to the status quo, don't default to the status quo just because you're having a hard time picking the best alternative. Force yourself to choose. Status Quo Bias - Avoidance 39
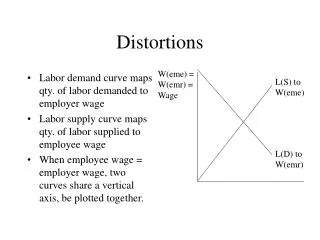
Knetsch (1989) experimentally demonstrates that such preferences can be usefully captured by utility functions defined over reference levels as well as consumption levels. Consider the following rather stylised graph. Distortions In Deriving Preferences - Status Quo Bias 40
The loci of points, IA and IB, represent indifference curves for bundles of Goods 1 and 2 for a consumer at, respectively, reference point A and reference point B. Distortions In Deriving Preferences - Status Quo Bias 41
Such indifference curves capture the status quo bias, because they imply that the consumer strictly prefers A over B if they are at A. Distortions In Deriving Preferences - Status Quo Bias 42
Such indifference curves capture the status quo bias, because they imply that the consumer strictly prefers B over A if they are at B. Distortions In Deriving Preferences - Status Quo Bias 43
More generally, they will tend to prefer bundles that avoid losses of any goods; thus, they will prefer X over Y if they are at A. Distortions In Deriving Preferences - Status Quo Bias 44
More generally, they will tend to prefer bundles that avoid losses of any goods; thus, they will prefer Y over X if they are at B. Distortions In Deriving Preferences - Status Quo Bias 45
With respect to the expected utility paradigm, people tend to weigh probabilities differently. Suppose you are asked: Distortions In Deriving Preferences - Probability Weighting 46
Given a chance for a gain of Euro 20,000, would you pay more to raise the probability of a gain from 0% to 1%, from 41% to 42%, or from 99% to 100%? While expected utility predicts that the answer should be the same, most people would pay significantly less for raising the probability to 42%. In particular, low probabilities are over weighted: people tend to find a 1% chance of winning Euro 1,000 preferable to a sure Euro 10. Distortions In Deriving Preferences - Probability Weighting 47
Empirical studies have shown that decision makers do not usually treat probabilities linearly. Instead, people tend to overweight small probabilities and underweight large probabilities. One way to model such distortions in decision making under risk is through a probability weighting function (Gonzalez and Wu 1999, Prelec 1998, Rachlin et al. 1991, Stewart et al. 2014). Distortions In Deriving Preferences - Probability Weighting 48
In addition to loss aversion, another important feature of how people assess departures from their reference levels is that they have diminishing sensitivity - the marginal change in perceived well being is greater for changes that are close to one’s reference level than for changes that are further away. Distortions In Deriving Preferences - Diminishing Sensitivity 49
As with loss aversion, Kahneman and Tversky (1979, p. 278) argue that diminishing sensitivity reflects a more fundamental feature of human cognition and motivation: Many sensory and perceptual dimensions share the property that the psychological response is a concave function of the magnitude of physical change (see definition and later slide) . Distortions In Deriving Preferences - Diminishing Sensitivity DefinitionsSlide 50