Download
1 / 22
220 likes | 540 Views
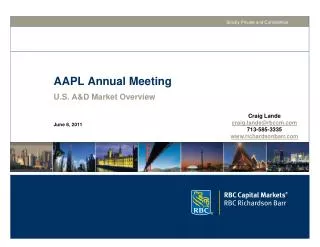
Strictly Private and Confidential. AAPL Annual Meeting. U.S. A&D Market Overview. Craig Lande craig.lande@rbccm.com 713-585-3335 www.richardsonbarr.com. June 8, 2011. By Commodity. By Sector. Conventional Oil. Public Company. Oil Resource Play. Private Equity . Conventional Gas.

E N D
Strictly Private and Confidential AAPL Annual Meeting U.S. A&D Market Overview Craig Lande craig.lande@rbccm.com 713-585-3335 www.richardsonbarr.com June 8, 2011
By Commodity By Sector Conventional Oil Public Company Oil Resource Play Private Equity Conventional Gas Private Company Gas Resource Play Tax Driven Tax Driven Opportunistic Opportunistic A&D Asset Supply ($ Billions) ($ Billions) $58.9 $58.9 Raising Shale Capital $31.1 $31.1 $24.0 $24.0 $15.2 $15.2 Oil & Gas Resource Plays continue to drive asset supply Publics JV-ing unconventional assets and selling conventional gas Note: Includes all U.S. transactions, including Gulf of Mexico
Last Twelve Months Mid Continent Rockies Appalachia (1) Gulf Coast (2) Permian Basin Legend Ark-La-Tex Regional Asset Supply – Conventional ($ Billions) 3-Year Average Mature Shale Gas (Barnett, Fayetteville) Conventional Oil • Includes Michigan. • Does not include Oxy / Shell transaction
Last Twelve Months Legend Niobrara Permian Resource Eagle Ford Bakken Marcellus Haynesville 3-Year Average Regional Asset Supply – Resource Plays ($ Billions)
Resource Plays do not have the capital of Majors U.S. E&P Landscape – M&A Driver in 2011 / 2012? Ranking By Enterprise Value ($ In Billions) Majors, Internationals, and financially sound Large-Caps are the likely buyers; resource players the likely targets
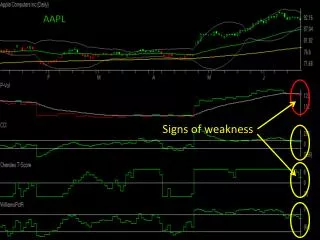
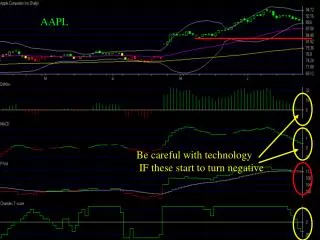
Comparison of Forward Crude Pricing Comparison of Forward Natural Gas Pricing Commodity Futures Curves Current Current Jan. 1 Jan. 1 The market remains bullish on oil while sentiment remains bearish in the natural gas market
Equity and Debt Capital Markets Activity Since January 1, 2007 Capital Markets Overview IPO Follow-On + Converts High Yield Investment Grade E&P Sector Capital Markets / Joint Venture Financing Activity Joint Venture $52.5 Private Equity $35+ B Debt $34.9 $34.4 $25.5 $20.3 Equity Source: Dealogic data as of May 10, 2011. Includes independents only - excludes capital raised from Majors / Integrateds.
Undeveloped Leasehold Expiring In 2011 & 2012 Public E&P Sector Capital Shortfall Analysis ($MM) Publics Co’s will be in Need of Capital to Fund 2011 Budgets Large Cap Resource Co’s Debt to ‘11E EBITDA: 1.9x Debt to Cap: 44.5% Small Cap Resource Co’s Debt to ‘11E EBITDA: 2.6x Debt to Cap: 52.0% Average = 42% Oil Weighted Companies Debt to ‘11E EBITDA: 1.4x Debt to Cap: 35.2% Bakken Companies Debt to ‘11E EBITDA: 0.7x Debt to Cap: 24.2% Source: FactSet estimates and latest company SEC filings as of June 2, 2011. Large Cap Resource Co’s includes: CHK, SWN, UPL, RRC, EQT, HK, XCO. Small Cap Resource Co’s includes: WKW, CRK, CRZO, GDP, REXX, GMXR Oil-Weighted Companies includes: CLR, CXO, DNR, WLL, PXP, BRY, REN Bakken Companies includes: CLR, BEXP, OAS, NOG, KOG
U.S. Onshore Transactions (2005 – 2008) U.S. Onshore Transactions (2010 – 2011 YTD) Top 10 Onshore Buyers – A Changing Landscape U.S. Large Caps were primary buyers Majors / Internationals emerge
Large & Mid Cap Oil Reserves E&P Equity Stock Performance Public E&P Universe # Gas Companies E&P Public Valuations # Oil Companies Sector Themes – Pivot to Oil Percentage of Total Reserves “Large-Cap” includes: OXY, APA, APC, DVN, EOG, ECA, CHK, WMB, NBL, SWN, EP, PXD, CLR, CXO, NFX, DNR, XEC, RRC, WLL, UPL, QEP, EQT, HK. “Mid-Cap” includes: PXP, COG, SM, XCO, EGN, SD, FST, BEXP, OAS, KWK, BRY, EXXI, ROSE, NOG, BBG, SFY, WTI, GPOR, SGY, CRK, CRZO, KOG, CWEI, PETD. “Large Cap Gas Resource Plays” includes: CHK, SWN, UPL, RRC, EQT, HK, XCO. “Oil-Weighted Companies” includes: OXY, CLR, CXO, DNR, WLL, PXP, OAS, BRY, REN “E&P MLPs” includes: LINE, BBEP, EVEP, LGCY, VNR, ENP, PSE, and QRE. “Bakken Companies” includes: CLR, BEXP, OAS, NOG, KOG.
Public Buyers – Low PDP; Oil / Resource Private Equity Buyers – Mid-PDP; Gas MLP Buyers – High PDP; Commodity Agnostic E&P Sectors are Looking for Unique Characteristics • High PDP • Low Decline • Mid PDP • Gas • Low PDP • Oil / Resource
Unconventional Demand By Buyer Unconventional Demand By Sector Unconventional Resources – Coming to America Note: Pie Charts demonstrate total transaction volume by Buyer Type and Sector from 2010 – 2011YTD.
Quiet A&D Market Deal competition created oversupply Current Conventional Oil Valuations Equate to a $140+ Oil Market WTI near month($/Bbl) $143,200 $145.29 / Bbl $116,800 $115,100 $111,100 $105,500 $102,600 $100,000 $97,700 $86,800 $81,100 $70,000 $100.40 / Bbl $31.14 / Bbl N/A N/A Note: Includes $50+ MM onshore oil transactions with R/P ratio of at least 10 years
Current Conventional Gas Valuations Reflect Commodity Price Henry Hub near month($/Bbl) $13.31 / MMBtu $20,400 $16,500 $4.63 / MMBtu $12,500 $11,800 $10,800 $10,700 $10,100 $9,700 $8,400 $7,900 $7,800 $8,200 $7,800 $1.88 / MMBtu Note: Includes $50+ MM onshore natural gas transactions with R/P ratio of approximately 10+ years
Conventional Oil Transactions Conventional Gas Transactions Regional Production Multiples for Conventional Oil & Gas Transactions Excludes Wolfberry PDP PV9 to PV7 PDP PV12 to PV10
$ / Acre Rising More De-Risking Needed U.S. Resource Play Valuations – $ / Acre Oil resource play acreage valuations continue to climb while natural gas resource play acreage valuations seem to have plateaued
Break-Even Economics for Key U.S. Oil Onshore Plays Oil / Liquids Plays – Required NYMEX WTI Strip For 10% IRR Average = $55.30 Source: Wall Street Research
Break-Even Economics for Key U.S. Gas Onshore Plays Natural Gas Plays – Required NYMEX Henry Hub Strip For 10% IRR Average = $3.56 Source: Wall Street Research
Operations • Premium paid for control Working Interest • Higher the better Production / Cash Flow • Conventional - need more • Resource - not as important, focus on de-risking R / P • 10+ years optimal Acreage • More is more, contiguous will get premium Lease Expirations • Need good term or won’t get paid (HBP is best) Commodity • Buyers bullish on oil, bearish on gas All Rights / All Depths • Impacts reserve analysis and ultimately value Overall Size • Bigger deals get premium over smaller deals Capital Markets • When open, more money chasing deals Deal Competition • Participation impacted adversely in busy market Asset Sale Valuation Drivers
What is Next for the U.S. MA&D Market? Joint Ventures / Foreign Capital Publics Continue Pivoting Towards Oil Conventional Deal Flow To Increase Private Equity Will Increase Investing MLPs / Trusts Will Increase $40 to $50 Billion in 2011 A&D
$196 million Bakken 66,000 Acres Bids Due June 9 $380 million Multi-Basin $175 million WillistonBasin Niobrara Shale Ark-La-Tex Barnett Shale Black Warrior Basin Mississippi Lime Marcellus Eagle Ford Mid Continent Appalachia Rocky Mountains Antrim Shale Bakken Shale Permian Basin 12,000 Acres July Data Rooms 53,000 Acres June Data Rooms 50,000 Acres Aug. Data Rooms Private Co. Private Co. 250,000 Acres July Data Rooms Glade Park Gas LP and $121 million Conventional $200 million Conv. Permian Confidential Eagle Ford $218 million Haynesville $210 million CBM Confidential Barnett Shale $967 million Barnett Shale RBC Richardson Barr – Selected Recent Transactions $330 million Antrim Shale $280 million Marcellus $406 million Marcellus 37,000 Acres June Data Room $330 million Conventional $145 million Conventional $210 million Conv. Multi-Basin $155 million Conventional 8 MMcfepd June Data Room Confidential Conv. Permian $265 million Bone Spring / Wolfberry $105 million Conv. Permian $185 million Wolfberry Confidential Conv. Permian $483 million Conv. Permian $900 million Conv. Multi-Basin $123 million Wolfberry Current Transactions
Bio – Craig R. Lande Craig R. Lande, Director • Craig Lande joined RBC Richardson Barr in June 2005. Mr. Lande has over 16 years of broad experience in the U.S. acquisition and divestiture market. Mr. Lande's transaction experience includes the sale of both public and private E&P companies, fairness opinions, general advisory and asset divestitures. Over the years, he has developed an extensive database that includes the acquisition and divestiture priorities of the majority of E&P companies in the U.S. Prior to RBC Richardson Barr, Mr. Lande worked in the Houston office of Waterous & Co. from 2001-2005 and served as a Vice President. Mr. Lande was actively involved in business development for the U.S. practice. He was also the creator and editor of the Quarterly Market Review, a newsletter focusing on upstream acquisition and divestiture valuations and trends. • From 1996 – 2001, Mr. Lande was a Senior Analyst with the energy investment banking firm Cornerstone Ventures, L.P. where he concentrated on corporate research and company and asset valuations. • Mr. Lande's professional speaking engagements include many to the SPEE, ADAM Energy Forum, Drilling Info and various Hart Energy Conferences. • Mr. Lande holds a Bachelor of Science degree in Business Management and Marketing from Tulane University.