
3’box
-200. -15. +700. +150. +350. -800. -500. 3. 4. 5. 6. U2. 3’box. DSE. PSE. -220. -55. +1. +215. PTF g. % of input. Figure S1. High resolution chromatin immunoprecipitation of PTF on U2 snRNA genes. qRT-PCR of ChIP analysis of the U2 gene using anti-PTF g antibodies and

3’box
E N D
Presentation Transcript
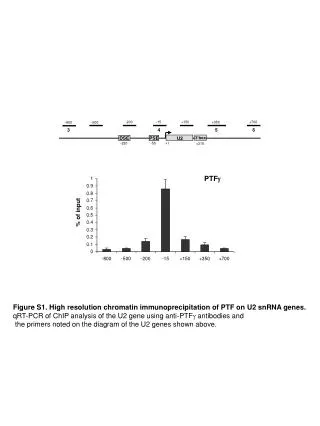
-200 -15 +700 +150 +350 -800 -500 3 4 5 6 U2 3’box DSE PSE -220 -55 +1 +215 PTFg % of input Figure S1. High resolution chromatin immunoprecipitation of PTF on U2 snRNA genes. qRT-PCR of ChIP analysis of the U2 gene using anti-PTFg antibodies and the primers noted on the diagram of the U2 genes shown above.
RNU2 locus b-actin gene Histone H4 Histone H4 % of input % of input Histone H2A Histone H2A % of input % of input Histone H2B Histone H2B % of input % of input Figure S2. All four histones have the same pattern of depletion on the U2 and the b-actin genes. qRT-PCR of ChIP analysis of the U2 and b-actin genes using antibodies against the histones noted.
RNU2 locus - a-amanitin Histone H3 RNA pol II + a-amanitin % of input % of input Figure S3. Nucleosomal depletion on U2 genes is transcription-independent. qRT-PCR of ChIP analysis of the U2 gene using antibodies against H3 and pol II, with or without treatment of the cells with a-amanitin.
+300 +500 +700 +850 +1500 +2100 7 8 CT-rich U2 3’box DSE PSE -220 -55 +1 +215 +600 transcription Histone H3 % of input NELF-E % of input CTCF % of input Figure S4.Fine mapping of NELF and CTCF on the RNU2 locus. qRT-PCR of ChIP analysis of the RNU2 locus, using antibodies against H3, NELF-E and CTCF using the primers noted on the diagram of the RNU2 locus above.
4 5 6 3 4a CT-rich U2 3’box DSE PSE -220 -55 +1 -800 +215 +600 RNU2 locus Ser7 relative to Pol II Ser5 relative to Pol II b-actin gene Ser5 relative to Pol II Ser7 relative to Pol II Figure S5.Distribution of Ser5 and Ser7 phosphorylation on the RNU2 locus and the b-actin gene. qRT-PCR of ChIP analysis using antibodies against phospho-Ser5 and phospho-Ser7, relative to the Pol II signal. The additional primer, 4a, is noted on the diagram of the RNU2 locus above. All other primers are as shown in Figure 1.
Spt16 Spt16 Pol II Pol II RNU2 locus b-actin gene Pol II level (% input) Pol II level (% input) Spt16 level (% input) Spt16 level (% input) Figure S6. FACT is associated with both snRNA and protein-coding genes. qRT-PCR of ChIP analysis of the U2 and b-actin genes, using antibodies against the Spt16 subunit of FACT. The pol II level is indicated by a dotted line. RNU2 locus b-actin gene AcH4/H4 H4 Ac-H4 (related to H4) Ac-H4 (related to H4) H4 level (% input) H4 level (% input) Figure S7. H4 acetylation across the RNU2 locus and b-actin gene. qRT-PCR of ChIP analysis of the U2 and b-actin genes using antibodies against H4 and acetyl H4 (Ac-H4). The H4 level is indicated by a dotted line and the Ac-H4 level is shown relative to total H4.
- - DRB DRB +DRB +DRB RNU2 locus b-actin gene H3-K36M3 (related to H3) H3-K36M3 (related to H3) Figure S8. H3-K36 trimethylation is DRB-sensitive. qRT-PCR of ChIP analysis of the U2 and b-actin genes using antibodies against trimethyl H3-K36 (H3-K36M3) with or without treatment of the cells with DRB. RNU2 locus b-actin gene H3-K9M3/H3 H3 H3-K9M3 (related to H3) H3 level (% input) H3-K9M3 (related to H3) H3 level (% input) Figure S9. H3-K9 trimethylation across the RNU2 locus and b-actin gene. qRT-PCR of ChIP analysis of the U2 and b-actin genes using antibodies against trimethyl H3-K9 (H3-K9M3). The H3 level is indicated by a dotted line and the H3-K9M3 level is shown relative to total H3.
Figure S10. Regions analysed by qRT-PCR after chromatin immunoprecipitation. Regions amplified by each pair of primers on the RNU2 locus, the b-actin, GAPDH and g-actin genes are indicated relative to the transcription start site.