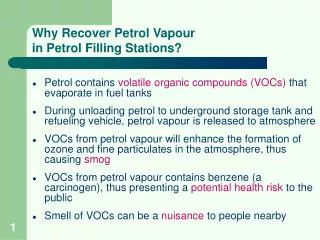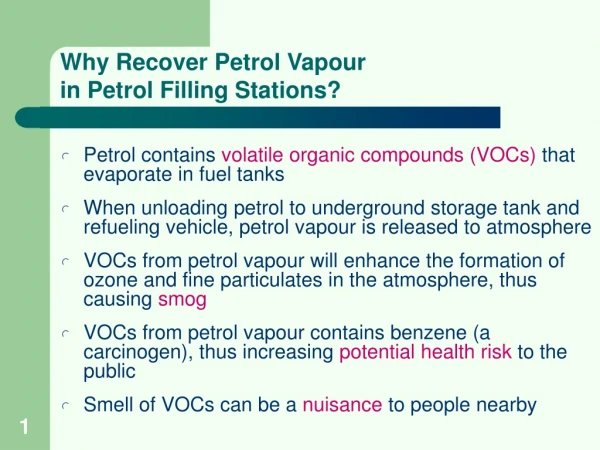
Jo-Petrol
170 likes | 458 Views
Jo-Petrol. Claims analysis 2012 - 2013 This report was prepared to present medical and analytical approach. Introduction. This report analyzes Jo-Petrol Claim semi annually expenditures for 2013 with comparison to the same period in the previous year

Jo-Petrol
E N D
Presentation Transcript
Jo-Petrol Claims analysis 2012 - 2013 This report was prepared to present medical and analytical approach.
Introduction This report analyzes Jo-Petrol Claim semi annually expenditures for 2013 with comparison to the same period in the previous year • Amounts with exception Retirement policy 2012 2013 Claimed value = 2,839,361JOD 2,889,141JOD Due value = (2,514,538) JOD (2,515,365) J0D ---------------------------------------------------------------------------------- Gross Saving value = 324,822JOD 373,776 JOD Gross Saving % = ( 11 % ) ( 13 % ) 49,780 1.7% 827 0%
General amounts 2012 2013 Due value = 2,514,538JOD2,515,365J0D Total debts = (213,085) JOD (217,933) JOD -------------------------------------------------------------------------------- Actualcost = 2,301,453JOD 2,297,432 JOD Actualcost Increase % =( 0.002% ) 4,021
General amounts 2012 2013 Total debts = 213,085 JOD 217,933 JOD Debit due to coinsurance =204,826 JOD 205,704JOD Debit due to contractual audit = 8,258 JOD 12,228 JOD
General amounts 2012 2013 Gross Saving value324,822 JOD 373,776 JOD (Claimed – Due) + Debit due to contractual audit 8,258 JOD 12,228 JOD ------------------------------------------------------------------------------------------------- Net saving value = 333,080 JOD 386,004 JOD Net saving % = 12% 13 % (from claimed value )
Monthly claim notices expenditures ( cost=Due-Debit ) 2012 = 2,301,432 0.002% 2013 = 2,297,427
Expenditures ( cost ) as per policy 2012 2013
Monthly number of processed visits 2012 = 65,856 4% 2013 = 68,473
Average Cost Per Visit 2012 = 35 2013 = 34
HCP category expenditures 2012 2013
Visits frequency by doctors specialty ( in percentage of total number of visits)
HCP category expenditures 2012 2013 1 1 2 2 2 2 4 4 4 4 3 3 1 1 3 3
Dependency expenditures 2012 2013
Hospital average cost per visit NatHealth 482 JOD
Out patient average cost per visit NatHealth 30.5 JOD