Download
1 / 18
210 likes | 368 Views
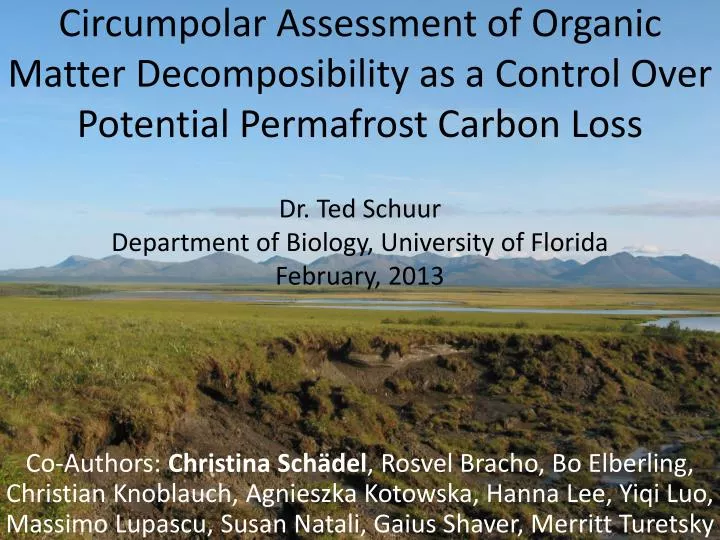
Circumpolar Assessment of Organic Matter Decomposibility as a Control Over Potential Permafrost Carbon Loss Dr. Ted Schuur Department of Biology, University of Florida February, 2013.

E N D
Circumpolar Assessment of Organic Matter Decomposibility as a Control Over Potential Permafrost Carbon Loss Dr. Ted Schuur Department of Biology, University of Florida February, 2013 Co-Authors: Christina Schädel, RosvelBracho, Bo Elberling, Christian Knoblauch, AgnieszkaKotowska, Hanna Lee, YiqiLuo, Massimo Lupascu, Susan Natali, Gaius Shaver, Merritt Turetsky
Vulnerability of Permafrost Carbon Research Coordination Network (RCN) http://www.biology.ufl.edu/permafrostcarbon/ PIs: Ted Schuur, A. David McGuire SteeringCommittee: Josep G. Canadell, Jennifer W. Harden, Peter Kuhry, Vladimir E. Romanovsky, Merritt R. Turetsky Postdoctoral Researcher: Christina Schädel Core funding: Additional Workshop funding: Workshop: May 2013; Annual Meeting @ AGU
Permafrost Carbon Feedback to Climate What is the magnitude, timing, and form of the permafrost carbon release to the atmosphere in a warmer world? Cumulative C Emissions: 1850-2005 (2012) Fossil Fuel Emissions 365 Pg Land Use Change 151 Pg Permafrost Zone C Emissions: Future? 7-11% Loss? 120-195 Pg Expert Survey (Schuur 2013)(162-288 Pg CO2-Ceq)
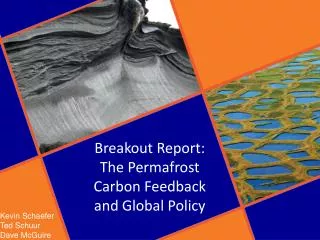
Working Group Activities Data syntheses in formats for biospheric or climate models 1) Permafrost Carbon Quantity Leads: GustafHugelius, C. Tarnocai, J. Harden Spatially distributed estimates of deep SOC storage; Quantifying uncertainties in circumpolar permafrost SOC storage 2) Permafrost Carbon Quality Leads: Christina Schädel, T. Schuur Incubation synthesis to determine pool sizes and decomposition rates; Network of long-term soil incubation experiments 3) Anaerobic/Aerobic Issues Leads: David Olefeldt, M. Turetsky Synthesis of CO2 and CH4 fluxes from northern lakes and wetlands; Controls on methane emission in permafrost environments 4) Thermokarst Leads: Guido Grosse, B. Sannell Metadata analysis of physical processes/rates; Analysis of thermokarst inventories; Distribution of thermokarst features in the Arctic 5) Modeling Integration & Upscaling Leads: Dave McGuire P. Canadell, D. Lawrence, Charles Koven, D. Hayes Evaluation of thermal and carbon dynamics of permafrost-carbon models; State-of-the-art assessment of the vulnerability of permafrost carbon and its effects on the climate system
Permafrost Carbon Network Members Current number of: Members: 135+ Institutions: 70 Countries: 16 Working Groups Carbon Quantity: 28 members Carbon Quality: 27 members An/Aerobic: 27 members Thermokarst: 33 members Modeling Integration: 50 members
Soil Organic Matter Decomposition Chemical recalcitrance (plant & microbial inputs plus transformation in soils) Physical Interactions (disconnection, sorption) Microbial communities (enzyme pathways) Environmental controls (pH, Temp, H2O, O2 , etc) Schmidt et al. 2011
Permafrost Zone Incubation Database 40 incubation studies (34 published, 6 unpublished) ~500 unique soil samples long-term incubation synthesis
Soil Incubation Synthesis • Lab incubations from • permafrost zone • (121 samples; • 8 studies) • Long-term incubations (1 year+) • Normalized • to5°C (Q10=2.5) • Upland boreal, tundrasoils • (Organic, surface <1m, deepsoils >1m)
Carbon Decomposition Model Total respiration 3-pool model Cp= Ctot-(Cf+Cs) C-pool dynamics Cf Cs rf rs rp R Partitioning coefficient Schädel et al. 2013 Oecologia
Partitioning Incubation CO2-C Flux total C-flux (measured) from passive C pool from slow C pool from fast C pool
Turnover Time Fast C pool Slow C pool Passive C pool p<0.05 n.s. 500-10,000 Years Model Parameter Time in ‘incubation years’; continuous flux at 5 deg C
Carbon Pool Sizes Fast C pool Slow C pool Passive C pool n.s. p<0.01 p<0.01
Multiple regression table Data were transformed to meet assumption of normality
Carbon Loss and C:N 1 year 10 year 50 year p<0.01 p<0.01 p<0.01 Time in ‘incubation years’; continuous flux at 5 deg C
Carbon Loss and Vegetation Type 1 year 10 year 50 year n.s. p=0.018 p=0.04 Time in ‘incubation years’; continuous flux at 5 deg C
Results Summary Vulnerability ranges from ~20% loss in organic soils to <5-10% for mineral soils [5 deg C; 10 incubation years] Vulnerability of boreal soils > tundra soils, but this difference diminishes over time Simple C:N and vegetation type metrics can be used to scale across landscapes and soil maps Full incubation dataset can determine sensitivity to changing environmental conditions
Future Upscaling Carbon Quantity Working Group • spatial extent • inventory 3m depth Hugelius et al. 2012 Modeling Working Group Permafrost thaw trajectories with IPCC scenarios Harden et al. 2012
Implications Carbon Pools x Thaw Trajectories x Incubation Rates = Potential Carbon Loss