Download
1 / 24
240 likes | 342 Views
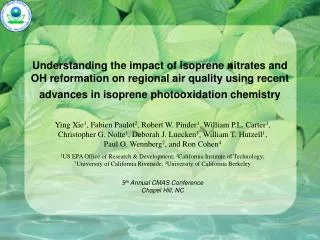
Influences of Regional Climate Change on Air Quality across the Continental U.S. Projected from Downscaling IPCC AR5 Simulations. Christopher G. Nolte 1 ,Tanya L. Otte 1 , Robert W. Pinder 1 , Jared H. Bowden 2 , Greg Faluvegi 3 , and Drew T. Shindell 3

E N D
Influences of Regional Climate Change on Air Quality across the Continental U.S. Projected from Downscaling IPCC AR5 Simulations Christopher G. Nolte1 ,Tanya L. Otte1, Robert W. Pinder1, Jared H. Bowden2, Greg Faluvegi3, and Drew T. Shindell3 1 U.S. Environmental Protection Agency, Research Triangle Park, North Carolina 2 Institute for the Environment, University of North Carolina 3 NASA Goddard Institute for Space Studies CMAS Users Conference 17 October 2012
Previous Results – Change in Air Quality Due to Future Climate Change ΔMean MDA8 O3, 1 Jun – 31 Aug ΔMean MDA8 O3, 1 Sep – 31 Oct Δ 95th percentile MDA8 O3, 1 Jun – 31 Aug Δ 95th percentile MDA8 O3, 1 Sep – 31 Oct Nolte et al., J. Geophys. Res., 2008
“Climate Penalty”: increase in ozone due to climate change, or the additional level of control needed to meet a given attainment level Weaver et al., BAMS (2009)
mean obs: 52.5 ppb mean model: 63.8 ppb mean bias: 11.3 ppb
Max summer temperatures in southern U.S. much too warm for current climate • Larger biases than in GISS 2’ GCM problematic downscaling • Typical retrospective meteorological modeling does not have biases this large!
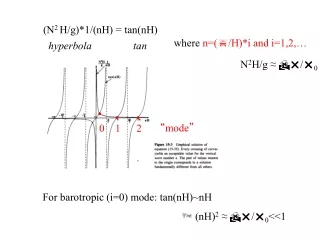
What is “dynamical downscaling”? Global climate model (GCM) creates coarse gridded future climate with world-wide coverage. GCM RCM Regional climate model (RCM) generates griddedhigher-resolution climate predictions over focal area. • More detail in local effects from: • scale-appropriate physics • topography & land/water interfaces • urban areas (population centers) • precipitation patterns
Approach to Developing Downscaling Methodology for Air Quality Simulation • Use reanalysis data as verifiable surrogate for GCM, to develop and test downscaling methodology • 20-year runs with historical data at 2.5° grid size (comparable to GCM) • Evaluate 36-km RCM results against higher-resolution reanalyses • Demonstrated that FDDA (nudging) is necessary For further details see Bowden et al. (J. Clim. 2012), Otte et al. (J. Clim 2012), and Bowden et al. (Clim. Dyn., in press). • Develop downscaled fields using GCM simulations • AR5 Ensemble: time slices, RCPs, other GCMs • NASA GISS ModelE2, NCAR CESM 1.0, NOAA GFDL CM3, … • Examine implications for future air quality
Downscaling NASA/GISS ModelE2 using WRF • ModelE2: AR5 runs at 2° x 2.5° • 40 hybrid layers up to 0.1 hPa • ca. 2000 (“1995–2005”) and RCP 6.0 ca. 2030 (“2025–2035”) • Meteorological input data used at 6-h intervals • WRFv3.2.1 • WRF Preprocessing System adapted to ingest raw ModelE fields • 108-36-km, two-way-nested, domains (81x51 and 199x127) • 34 layers up to 50 hPa • Continuous 11-year runs (no reinitialization) • Spectral nudging of wavelengths >1500 km • Analysis nudging qualitatively similar (not presented here)
Representation of Current Climate July Temperatures Decadal mean July 2-m temperature (°F) Decadal mean July daily max 2-m temperature (°F)
Air Quality Simulations Using Downscaled Meteorology • Our goal is NOT to predict air quality at some future time. Rather, we seek to answer these questions: • How well does meteorology downscaled from GCM capture range of conditions important for regional air pollution meteorology? • How does the interannual meteorological variability translate into variability of air quality? • What are the changes in future air quality for this GCM scenario, and what are the principal drivers of those changes? • How robust are the above conclusions, when considering an ensemble of GCMs, RCPs, and future decades?
Air Quality Model Configuration • Constant (for each year) anthropogenic emissions. • 2006 inventory (same as AQMEII) • Biogenics simulated online using downscaled meteorology • Constant (clean, default) chemical boundary conditions • CMAQ v5.0 (offline), SAPRC07 • Using online photolysis and lightning NOx • Wind-blown dust option turned off • 36-km North American domain (153 x 100) • WRF and CMAQ run for 11-year time slices centered on 2000 and 2030
Multi-year Summer Mean MDA8 Ozone Under Current Climate GISS Model E2 – WRF – CMAQ 5.0.1 2002-2006 Retrospective CMAQ 4.7 GISS 2′ – MM5 – CMAQ 4.5 Lots of differences between these runs impair ability to make direct comparisons … but preliminary analysis shows significant improvement over previous result.
Average Annual Frequency of Exceeding 75 ppb Threshold GISS Model E2 – WRF – CMAQ 5.0.1 2002-2006 Retrospective CMAQ 4.7 GISS 2′ – MM5 – CMAQ 4.5 • Spatial pattern of exceedances well reproduced by ModelE-WRF-CMAQ. • Overall higher frequency consistent with small positive bias in MDA8 O3.
Projected Change (2030 −2000) in July 2-m Temperatures ModelE2 ΔT2MEAN ModelE2 ΔT2MAXDAVG WRF ΔT2MEAN WRF ΔT2MAXDAVG K ModelE2: Warming of up to 2 K in central US, slightly higher for daily max. WRF generally consistent with ModelE2, with somewhat greater variability. 3.6 2.8 2.0 1.2 0.4 -0.4 -1.2 -2.0 -2.8 -3.6
Changes in Air Quality Under Future Climate ΔJJA MDA8 O3 ΔT2MAXDAVG Increases of 0.5-2 ppb MDA8 O3, largely consistent with area of warming of 0.5-2 K in central/eastern US.
Annual Frequency of Exceeding 75 ppb MDA8 1995-2005 average 2025-2035 average Small (statistically insignificant, p=0.4) increase in frequency of exceeding 75 ppb threshold
Conclusions • Substantial progress in establishing credibility of regional climate fields downscaled from global model. • Reanalysis-driven runs verify well against NARR (though not as well as retrospective modeling runs) • Downscaled ModelE fields seem reasonably representative • MDA8 ozone positively biased, but greatly improved over previous efforts using linked global-to-regional modeling system. • GISS simulation of RCP 6.0 results in summertime warming of 0.5-2 K over central/eastern US around 2030 – consistent result between ModelE and WRF. • How to demonstrate “added value” of downscaling? • Relatively modest increases of 0.5-2 ppb MDA8 O3 due to this climate change scenario (holding anthropogenic emissions constant).
CIRAQ Representation of Current July Temperature Model Multi-year mean July 2-m temperature (°F) Model Multi-year mean July daily max 2-m temperature (°F)
Effects of Nudging on Means: Multi-Decadal Historical Period Monthly Area-Average Differences in 2-m Temperature (K) Winter too warm 4 2 Compare to hourly, 0.31° CFSR 0 -2 Summer too cold -4 88 89 90 91 92 93 94 95 96 97 98 99 00 01 02 03 04 05 06 07 Otteet al., J. Climate (2012) • Periodic intra-annual swings in bias in WRF without nudging. • Should not examine only annual or multi-decadal means! • Systematic error in seasonality? (Also in GCM-driven WRF runs!)
mean obs: 52.5 ppb mean model: 63.8 ppb mean bias: 11.3 ppb mean obs: 52.5 ppb mean model: 59.9 ppb mean bias: 7.5 ppb
Initialized in Dec 1994 Initialized in Dec 2024 Initialized in Dec 1995 Initialized in Dec 2025