Download
1 / 26
260 likes | 582 Views
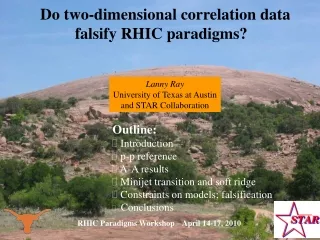
The away-side ridge in two-dimensional correlation data from STAR. Lanny Ray University of Texas at Austin STAR Collaboration. Our Philosophy and Challenge. The philosophy behind the analysis presented here is based on an old and simple idea:

E N D
The away-side ridge in two-dimensional correlation data from STAR Lanny Ray University of Texas at Austin STAR Collaboration
Our Philosophy and Challenge • The philosophy behind the analysis presented here is based on an old and simple idea: • measure p-p and try to understand those data in terms of QCD, PDFs, FFs. • then move to p+Au (d+Au) and understand those data (initial state, sequential scattering effects) • then move to Au-Au and see if the data require anything else • interpret data with new physics mechanisms, beyond that in p-p, p-A • only when the data demand it. • This is not a new idea, e.g. in Sept. 1992 at a STAR collaboration meeting • Miklos Gyulassy outlined this very program. • I hope that this workshop will live up to its title of critically assessing the data and its • Interpretation. • Outline: • Definitions • p-p and QCD • Centrality evolution • Same-side structures • Away-side ridge • Implications
Correlation measure ρ(p1,p2)= 2 particle density ρsibling(p1,p2) Event 1 ρreference(p1,p2) Event 2 Fill 2D histograms (a,b), e.g. (f1,f2), (h1,h2), (f1-f2,h1-h2), (pt1,pt2), etc. measures number of correlated pairs per final state particle square-root of rref(a,b); (for h,f space) normalized ratio of 2D binned histograms; acceptance cancellation; two-track ineff. corrections Motivated by p-p superposition null hypothesis
Transverse momentum correlations in p-p 200 GeV p-p minbias LS – like sign US – unlike sign transverse rapidity same-side bump at 1 GeV/c for US; soft structure varies Dr/√rref Dr/√rref SS - same side STAR Preliminary away-side bump at 1 GeV/c is independent of charge pair Dr/√rref Dr/√rref AS - away side 10.0 1.0 pt(GeV/c) 0.15 Two-component soft + semi-hard structure
yt2 yt1 Angular correlations for p-p p-p transverse correlations p-p axial correlations STAR Preliminary φΔ ηΔ soft component semi-hard component φΔ φΔ ηΔ ηΔ This looks like a jet – but is it? 2D Gaussian + away-side ridge Longitudinal Fragmentation: 1D Gaussian onηΔ HBT peak at origin, LS pairs only
“Jets” in UA1 Energy clusters were measured by UA1 down to 5 GeV/c in p-pbar collisions at sqrt{s} = 200 – 900 GeV; accounted for with pQCD; back-to-back angular correlations and pt structures are “jet-like.” pQCD calc. C. Albajar (UA1) Nucl. Phys. B 309, 405 (1988)
Relation of UA1 jets to p-p correlations STAR observes angular correlated charged hadron pairs with pt ~ 1 – 1.5 GeV/c corresponding to typical parton pt of order >(3/2)(2)(1 – 1.5) = 3-4.5 GeV/c, well within reach of the UA1 data and pQCD descriptions. X.-N.Wang and M. Gyulassy implemented the UA1 observations into their Monte Carlo code HIJING (PYTHIA) (Phys. Rev. D 44, 3501 (1991)) using standard PDFs, pQCD parton-parton cross sections, and standard fragmentation functions. The low-pt parton energy follows a power-law until a cut-off at Q0 ~ 2 GeV. The majority of produced jets have Q0 ~ few GeV and only produce a few hadronic fragments. In Au-Au we cannot hope to identify these low Q0 jets directly. There is also no identifiable trigger particle at lower pt. Thus we use both angular and (pt1,pt2) correlations for all pairs as suggested by Xin-Nian Wang a long time ago (Phys. Rev. D 46, R1900 (1992)). These soft, untriggered jets are known in the literature as minijets. How would minijets appear in our 2D (h,f) angular correlations?
Jet-A proton p-p 200 GeV parton-parton cm Jet-B NN cm A-A B-B h A-B B-A A-A B-B A-B B-A STAR preliminary proton Number of pairs Number of pairs h1-h2 0 Φ1 - Φ2 large azimuth peak 0 p fD=f1-f2 small angle peak η1 - η2 Example: di-minijets sum over many events
Hijing Jets on fD ~20% agreement hD additional sharp peak: HBT, conversion electrons fD Hijing Jets off hD STAR Preliminary fD hD Minijets in HIJING & PYTHIA p + p at 200 GeV soft pt pairs removed We conjecture that the bump at 1 GeV/c in the (yt,yt) and the above angular correlations are generated by the fragmentation of semi-hard scattered partons. These minijets are simply jets with no low pt cut-off.
Au-Au centrality evolution of the 2D correlations (Expectation is that minijets will be thermalized.)
(yt1,yt2) correlations for same-side pairs Au-Au 200 GeV Like Sign peripheral central pp HBT peripheral Unlike Sign central pp minijets persist; pt dissipation STAR Preliminary From M. Daugherity’s Ph.D Thesis (2008)
(yt1,yt2) correlations for away-side pairs Au-Au 200 GeV Like Sign peripheral central pp minijets peripheral Unlike Sign central pp minijets persist; pt dissipation STAR Preliminary From M. Daugherity’s Ph.D Thesis (2008)
proton-proton 200 GeV Au-Au data Analyzed 1.2M minbias 200 GeV Au+Au events; included all tracks with pt > 0.15 GeV/c,|η| <1, fullφ note: 38-46% not shown 84-93% 74-84% 64-74% 55-64% 46-55% φΔ ηΔ 18-28% 9-18% 28-38% 5-9% 0-5% φΔ ηΔ STAR Preliminary We observe the evolution of several correlation structures including the same-side low pt ridge From M. Daugherity’s Ph.D Thesis (2008)
Fit function Same-side “Minijet” Peak, 2D gaussian Away-side -cos(φ) Proton-Proton fit function STAR Preliminary “soft” “hard” = + φΔ φΔ φΔ ηΔ ηΔ ηΔ dipole longitudinal fragmentation 1D gaussian HBT, e+e- 2D exponential cos(2φΔ) • Au-Au fit function • Use proton-proton fit function plus • cos(2φΔ) quadrupole term (~ elliptic flow). quadrupole Note: from this point on we’ll include entire momentum range instead of using soft/hard cuts φΔ ηΔ
fD < p/2 Same-side correlation structure The “soft” ridge
Same-side 2D Gaussian & binary scaling - AuAu Peak Amplitude Peak η Width Peak φ Width STAR Preliminary STAR Preliminary STAR Preliminary Statistical and fitting errors are ~5-10% Systematic error is 9% of correlation amplitude 200 GeV 62 GeV constant widths peripheral central HIJING 1.382 default parameters, 200 GeV, quench off Binary scaling: Kharzeev and Nardi model Deviations from binary scaling represent new physics unique to heavy ion collisions
Does the transition point scale? Transverse Particle Density Peak amplitude h width h/f aspect ratio volume S = overlap area (Monte Carlo Glauber) STAR Preliminary Peak Amplitude Peak Amplitude Peak η Width Peak η Width Bjorken Energy Density Npart STAR Preliminary STAR Preliminary STAR Preliminary STAR Preliminary 200 GeV 62 GeV 200 GeV 62 GeV εBJ εBJ Npart Npart Peripheral bins are compressed. Depends on formation time (assumed 1 fm/c), difficult to compare energies. 2D Gaussian amplitude, h-width, volume scale with particle density in Au-Au
Transition – close-up (Au-Au 200 GeV) Does the transition from narrow to broad ηΔ occur quickly or slowly? data - fit (except same-side peak) STAR Preliminary 83-94% 55-65% 46-55% 0-5% ηΔ width Large change within ~10% centrality Smaller change from transition to most central low-pt manifestation of the “ridge” Shape changes little from peripheral to the transition The transition in same-side ridge occurs quickly
Implications: superposition model Expected behavior: • Minijet shape unchanged, amplitude follows binary scaling. • Minijet peak on (yt,yt) unchanged except for amplitude. Comparison with data: Superposition model approximates data to the transition point, implying an approximately transparent system, but radically fails at higher density, more central collisions. STAR Preliminary
Minijets & Quadrupole STAR Preliminary STAR Preliminary Below the transition the Au-Au system appears transparent, i.e. no collisional pressure build-up, no flow, at least up to the transition point. If a few secondary collisions (LDL) produce v2 in peripheral collisions, why aren’t the minijets affected (same pt range)? expected v2? What mechanism(s) produces a smooth v2?
fD > p/2 Away-side correlation structure The away-side ridge
Q ~ 2 GeV minijets, nucleon KT , acoplanarity Low-x parton KT ~ 1 GeV/c KT broadening pz Low-x parton events 1,2,3… p 0 sum events φΔ p 0 away-side φΔ -3p -pp 3p 0 Away-side ridge (dipole) – local pt conservation 200 GeV 62 GeV The dipole matches the centrality dependence of the same-side Gaussian and shows the same transition point. It’s origin is pt conservation: global + jets STAR Preliminary calculated global pt conservation Hijing – jets on (no soft pt)
Implications: opaque core + hadronic corona Expected behavior: • pt correlations remain • (yt,yt) dissipates but amplitude remains at minijet yt • same-side 2D Gaussian remains • However, same-side yield decreases unless enough hadrons from surface are correlated with minijet. • Some jets will lose away-side partner, reducing –cos(fD) away-side pt escapes, but is dispersed among many more pairs Comparison with data: Ratio of away-side ridge to same-side Gaussian is ~constant from peripheral to most-central; data are inconsistent with this scenario
Mach Cone ? Au+Au 200 GeV 0-5% most-central Shown are Data – Quadrupole which isolates the away-side dipole structure STAR Preliminary hD fD fD No indication of a double away-side ridge – no Mach cone
Please stop using ZYAM! ZYAM method assumes non-overlapping peaks above background – questionable Example: fake “data” generated by same-side Gaussian + dipole v2{2} obtained from due to SS Gauss. ZYAM deduced correlation wrong amplitude! spurious shape! nonphysical input correlation ZYAM procedure subtracts v2 and adjusts offset. ZYAM • Always plot the raw correlation data • v2 is being over-subtracted; v2{2} or [v2{2} + v2{4}]/2 • includes SS peak contribution, i.e. non-flow, which is larger • at higher pt where this analysis is usually done. Plots from Tom Trainor
Summary and Conclusions • Correlation structures in minbias p-p collisions can be understood with pQCD, PDFs, and standard FFs. • Minijets (jets with no low-pt cut-off) are an essential component of RHIC collisions and are manifest in (yt,yt) and 2D angular correlations. • Up to the transition minijets escape from the entire collision volume (binary scaling) with little broadening as if from a transparent medium. • The transition, observed in the same-side peak, is also observed in the away-side ridge. • The transition is not manifest in v2 (quadrupole) implying that v2 is not affected by post-impact rescattering. • The minimum-bias away-side correlations do not show evidence of a double-hump structure reported in leading particle-associated Df analyses.