Download
1 / 24
240 likes | 353 Views
Who Gets What? The Distribution of Income Ch. 11, p. 301-309. Describe the inequality in income and wealth in the U.S. and the world. Explain why wealth inequality is greater than income inequality. Explain how economic inequity arises. Explain poverty and its potential causes/effects.

E N D
Who Gets What? The Distribution of IncomeCh. 11, p. 301-309 Describe the inequality in income and wealth in the U.S. and the world. Explain why wealth inequality is greater than income inequality. Explain how economic inequity arises. Explain poverty and its potential causes/effects.
Measuring economic equity and equality Equity—normative concept of fairness in distribution of wealth and income Customs, laws, traditions to help disadvantages members of society Equity in income distribution is interpreted as greater equality Equality—spreading wealth and income equally, regardless of position or income in society May or may not be equitable We measure economic inequality by looking at the distributions of income and wealth Household’s income is the amount that it receives in a given period Household’s wealth is the value of the things it owns in a point in time
Fairness and Equality • Most Americans see fairness as equality of opportunity • There are great differences of opinion as to what constitutes “equal opportunity” • There are three problems in determining whether an equal income distribution is fair: People do not start from equivalent positions People’s needs differ People’s efforts differ 20-3
Economic statements “There is nothing wrong with a society where people starve alongside the extremely rich.” Doesn’t this show that the problem of who gets what, is solved by society? “The rich should pay more for university education.” “It is economically more efficient to increase output rather than redistribute it.” What do you think?
Ways of Considering the Distribution of Income • Share distribution of income is the relative division of total income among income groups • For example, it measures how much income the top 5% or 15%, or the bottom 10% gets • Socioeconomic distribution of income is the allocation of income among relevant socioeconomic groups • For example, how much do women get compared to men, old compared to young, black compared to white
Quick review Remember that in a market economy, the amount of g/s households receive depends on their income; income is based on payments received by selling the FoP they own Output and income in a market economy depend on how many resource consumers (households) own and are able to sell in resource markets, as well as on the prices of the FoP sold. The problem of income distribution then is that ownership of FoP is highly unequal, and because prices determined of FoP vary enormously in the market Markets cannot ensure that everyone in population will secure enough income to satisfy their basic needs (a disadvantage of the market system). Redistribution of income happens when governments use a variety of methods to change market-determined distribution of income and output (to achieve a more socially desirable one).
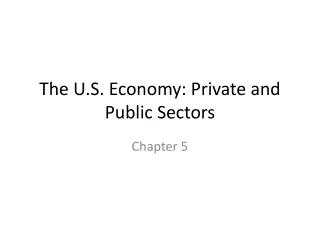
The Lorenz Curve • A Lorenz curve is a geometric representation of the share distribution of income among families in a given country at a given time • measures the cumulative percentage of total income on the Y axis and cumulative percentage of all wage earners on the X axis • both axes start at zero and end at 100% • 45 degree line is line of perfect equality (1% of income goes to 1% of wage earners…) • The curve, then, shows uneven income distribution • Further away from the 45 line, the more inequality exists • This is measured in quintiles (20% portion of the population; Q1-Q5) • Can also be measured in deciles (10%) or quartiles (25%)
Lorenz Curve % of National Income This line represents the situation if income was distributed equally. The poorest 10% would earn 10% of national income, the poorest 30% would earn 30% of national income. 30% 10% 10% 30% Percentage of Population
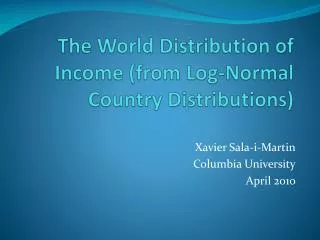
Gini Coefficient The total area under the line of equality • Enables more precise comparison of Lorenz Curves • The proportion of the area taken up by the Lorenz Curve in relation to the overall area under the line of equality % of National Income The area bounded by the Lorenz Curve Percentage of Population
The Gini Coefficient Pros Generally regarded as gold standard in economic work Incorporates all data Allows direct comparison between units with different size populations Attractive intuitive interpretation Cons Requires comprehensive individual level data Requires more sophisticated computations Twice the area between the Lorenz curve and the equality diagonal.
A Hypothetical Lorenz Curve The data in (a) were used to derive the Lorenz curve in (b). The Lorenz curve shows the cumulative percentage of income earned by the cumulative percentage of households. If all households received the same percentage of total income, the Lorenz curve would be the line of perfect income equality. The bowed Lorenz curve shows an unequal distribution of income. The more bowed the Lorenz curve is, the more unequal the distribution of income.
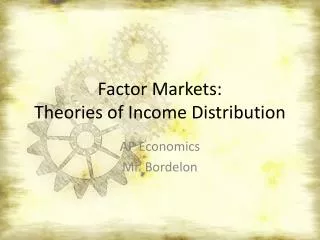
The Lorenz Curve A Lorenz Curve for the U.S., 1929, 1970, and 2007 Cumulative % of income 100 From 1929 to 1970, income inequality decreased Line of absolute equality 80 From 1970 to 2007, income inequality increased 60 2007 40 1970 20 1929 Cumulative % of Families 0 20 40 60 80 100 20-12
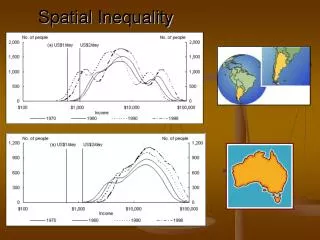
World distribution of wealth Lorenz Curve The richest 10% possessed 46.9% of the world wealth in 1988. Line of total integration Cumulative Wealth (PPP) Cumulative Global Population
Calculating the Gini Coefficient Although the Lorenz Curve is good visual indicator of distribution equality, the Gini Coefficient provides a clearer quantatitive value. A / B = Gini Values should lie between 0 (total integration) to 1 (total segregation). B Line of total integration Cumulative Wealth (PPP) A Cumulative Global Population
Defining Poverty • Poverty can be defined as a relative or absolute concept • The U.S. government definition of poverty is a combination of a relative and an absolute measure • The poverty threshold is the income below which a family is considered to live in poverty • Equal to or less than three times an average family’s USDA-calculated minimum food expenditures 20-15
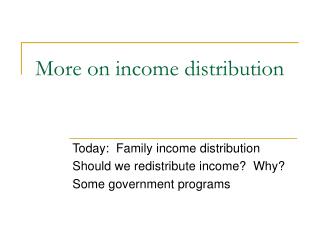
The Distribution of Wealth • Wealth is the value of assets individuals own less the value of what they owe • It is a stock concept representing the value of assets such as houses, buildings, and machines • Income is payments received plus or minus changes in value of a person’s assets in a specified time period • It is a flow concept, a stream through time • In the U.S., wealth is significantly more unequally distributed than is income 20-16
The Distribution of Wealth The distribution of wealth and wealth compared to income Cumulative % of income 100 Line of absolute equality 80 60 Family Income 40 Household Wealth 20 Cumulative % of Families 0 20 40 60 80 100 20-17
Socioeconomic Dimensions of Income Inequality Median Income 20-18
Income Distribution According to Class The class system as a pyramid, a diamond, and a pentagon Upper class Upper class Upper class Middle class Middle class Middle class Lower class Lower class Lower class A developing country’s class system U.S. class system in the 1960s and 1970s U.S. class system in recent years 20-19
Distributional Questions and Tensions in Society • Both radicals and libertarians describe the tensions among classes in society better than the mainstream, classless analysis • Mainstream economists focus on the share distribution of income • Radicals focus on class and group structures • Libertarians emphasize the role of special interests in shaping government policy 20-20
Three Important Side Effects of Redistributive Programs • Society may decide to redistribute income from rich to poor to meet its ideal of fairness • There are three side effects of redistribution of income: • The labor to leisure incentive effect • The tax avoidance or evasion incentive effect • The incentive to appear more needy than you actually are • Often politics, not value judgments, plays a central role in determining what taxes and individual will pay 20-21
Taxation to Redistribute Income • A progressive tax is a one in which the average tax rate increases with income • It redistributes income from the rich to the poor • A proportional tax is a one in which the average tax rate is constant regardless of income • It is neutral in regard to income redistribution • A regressive tax is a one in which the average tax rate decreases as income increases • It redistributes income from poor to rich 20-22
Expenditure Programs to Redistribute Income • Social Security is a social insurance program that provides financial benefits to the elderly and disabled and to their eligible dependents and/or survivors • Expenditure programs have been more successful than taxation for redistributing income Examples of expenditure programs: • Medicareis a medical insurance system for retired people 20-23
Distribution of Income before and after Taxes and Transfers Cumulative % of income Although little redistribution takes place through the tax system, more occurs through the transfer system 100 Line of absolute equality 80 60 The after-tax and transfer distribution of income is more equal than the before-tax-and-transfer distribution of income Before taxes and transfers 40 After taxes and transfers 20 Cumulative % of Families 0 20 40 60 80 100 20-24