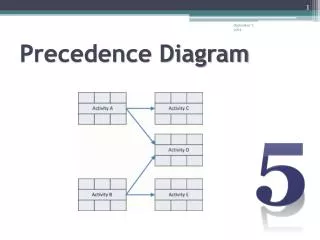
Time Planning and Con trol Precedence Diagram
Time Planning and Con trol Precedence Diagram. Precedence Diagramming. An important extension to the original activity-on-node concept appeared around 1964 . The sole relationship used in PERT/CPM network is finish to start type of dependency, with Fs ij = 0 .

Time Planning and Con trol Precedence Diagram
E N D
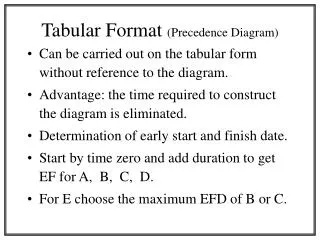
Presentation Transcript
Precedence Diagramming • An important extension to the original activity-on-node concept appeared around 1964. • The sole relationship used in PERT/CPM network is finish to start type of dependency, with Fsij = 0 . • Precedence diagramming includes precedence relationships among the activities. In Addition, one may specify a “lag time” associated with any of the precedence relationships, which can be used to account for overlapping times among activities. • The computation of activity times (published in 1973) is more complex than AON.
Lag / Lead Times • In many cases, there is a delay between the completion of one activity and the start of another following or there is a need to show that one activity will overlap another in some fashion. • A successor "lags" a predecessor, but a predecessor "leads" a successor. • Lag time can be designated on a dependency line with a positive, negative, or zero value. • Limitations and Disadvantages of Lag: • Lag would complicate the scheduling process. • Lags are not extensively used except where the time effects are substantial for special project type.
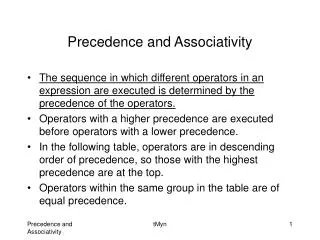
Precedence Diagramming Relationships Types and constraint • Start-to-Start (SSij) • [(j) cannot start till (i) starts by amount of the SS] • The value of SSijis equal to the minimum number of time units that must be completed on the preceding activity (i) prior to the start of the successor (j). “Lag” is always applied to SS relation. • Example SSij =3 [The start of (j) must lag 3 units after the start of (i)] • Finish-to-Finish (FFij) • [(j) cannot finish till (i) finishes by amount of the FF] • FFij is equal to the minimum number of time units that must remain to be completed on the successor (j) after the completion of the predecessor (i). • Example FFij =5 [The finish of (j) must lag 5 units after the finish of (i) ]
Precedence Diagramming Relationships Types and constraint Finish-to-Start (FSij) [(j) cannot start till (i) finishes by amount of the FS] FSijis equal to the minimum number of time units that must transpire from the completion of the predecessor (i) prior to the start of the successor (j). Example FSij =6 [The start of (j) must lag 6 units after the finish of (i)] • Start-to-Finish (SFij) • [(j) cannot finish till (i) starts (rare)] • SFijis equal to the minimum number of time units that must transpire from the start of the predecessor (i) to the completion of the successor (j). • Example SFij(SFij‘ + SFij “) =(4+6) =10 [The finish of (j) must lag 10 units after the start of (i)]
Precedence Diagramming Relationships Types and constraint Start-to-Start and Finish-to-Finish (ZZij): ZZij is a combination of two constraints, i.e., a start-to-start and finish-to-finish relationship. It is written with the SSij time units first, followed by the FFij time units. Example ZZij=5 , 6 [The start of (j) must lag 5 units after the start of (i) (SSij= 5) & The finish of (j) must lag 6 units after the finish of (i) (FFij= 6)] Types of constraints with lag/lead Durations
Precedence DiagrammingCalculations SF 12 • EXAMPLE SS 3 FF 4 For the given precedence diagram, complete the forward and backward pass calculations. Assume the project starts at T=0, and no splitting on activities is allowed. Also assume that the project latest allowable completion time (project duration) is scheduled for 30 working days. SS 6 FS 0 D Test & debug program (D=6) F Decument program (D=12) A Develop system spec. (D=8) B Write comp. program (D=12) FS 0 C Collect system data (D=4) E Run program (D=6)
Precedence DiagrammingCalculations C E D 12 0 4 6 6 END F SF 12 • AON diagram SS 3 FF 4 SS 6 12 B FS 0 D Test & debug program (D=6) F Decument program (D=12) A 8 A Develop system spec. (D=8) B Write comp. program (D=12) FS 0 C Collect system data (D=4) E Run program (D=6)
Precedence DiagrammingCalculations C E D 12 6 4 6 0 END F Forward Pass Computations SF 12 • Example Computation SS 3 FF 4 SS 6 FS 0 12 B Activity A Activity B FS 0 0 A 8 8 3 15 Activity C 13 9
Precedence DiagrammingCalculations C E D 12 6 0 6 4 END F Forward Pass Computations SF 12 • Example Computation SS 3 FF 4 SS 6 FS 0 12 B Activity D Activity E FS 0 15 21 15 27 0 A 8 8 3 15 27 27 Activity F 13 21 27 9
Precedence DiagrammingCalculations C E D 12 6 0 4 6 END F SF 12 • Example Computation Backward Pass Computations SS 3 FF 4 SS 6 FS 0 12 B Activity F Activity E FS 0 15 21 15 27 Activity D 0 18 3 24 18 3 30 A 8 8 3 15 27 27 13 21 27 9 30 3 30 24 3 30
Precedence DiagrammingCalculations C E D 4 12 6 6 0 END F SF 12 • Example Computation Backward Pass Computations SS 3 FF 4 SS 6 FS 0 12 B Activity C FS 0 Activity B 15 21 15 27 0 18 3 24 18 3 30 A 8 8 3 15 27 27 Activity A 13 21 27 9 3 3 11 6 3 18 30 3 30 14 5 18 24 3 30
Precedence DiagrammingCalculations Earliest Earliest Latest Latest On Start Finish Start Finish Slack Critical Activity ES EF LS LF LS – ES Path A08 311 3 No B3156183 No C91314185 No D152115213 No E212724303No F152718303 No • Computing Slack Time (Float Time)
Example 2 Given the precedence network for a small engineering project with activity durations in working days, it is required to compute the activity times (ES, EF, LS, and LF) and total floats (TF) and then indicate the critical activities.
Example 2 Calculate the Early activity times (ES and EF).
Example 2 Calculate the late activity times (LS and LF).
Example 2 Calculate Total Float for an activity.
Example 2 Indicate the critical activities.
Notes on Schedule • HAMMOCK ACTIVITY • An activity that extends from one activity to another, but which has no estimated duration of its own. • It is time-consuming and requires resources, but its duration is controlled, not by its own nature, but by the two activities between which it spans. • Its ES and LS times are determined by the activity where it begins and its EF and LF times are dictated by the activity at its conclusion. • Examples: Dewatering, Haul road maintenance
Notes on Schedule • MILESTONES • Milestones are points in time that have been identified as being important intermediate reference points during the accomplishment of the work. • Milestone events can include dates imposed by the customer for the finishing of certain tasks as well as target dates set by the project manager for the completion of certain segments of the work.
Notes on Schedule • MILESTONES • Distinctive geometric figure is preferred to represent a milestone (circles, ovals, or other shapes) can be used. • Any information pertaining to a milestone and considered to be useful may be entered.
Notes on Schedule • Reducing Project Duration How can you shorten the schedule? Via • Reducing scope (or quality) • Adding resources • Concurrency (perform tasks in parallel) • Substitution of activities