Download
1 / 15
150 likes | 261 Views
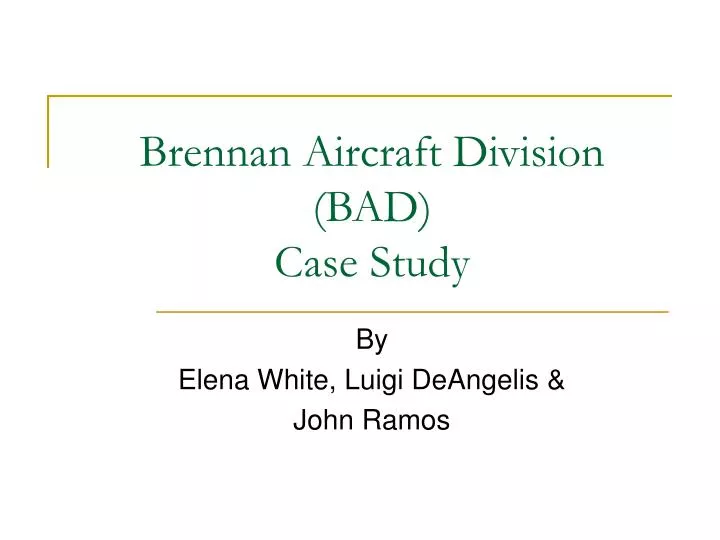
Brennan Aircraft Division (BAD) Case Study. By Elena White, Luigi DeAngelis & John Ramos. Overview of Presentation. Executive Summary Data Analysis Basis of Simulation Conclusion. Executive Summary . BAD operates large number of plotting machines

E N D
Brennan Aircraft Division (BAD)Case Study By Elena White, Luigi DeAngelis & John Ramos
Overview of Presentation • Executive Summary • Data Analysis • Basis of Simulation • Conclusion
Executive Summary • BAD operates large number of plotting machines • Consist of minicomputer system that directs 4 pens to move until desired figure is drawn • Connected to a 4 – by-5 foot table with series of ink pens suspended above it • Very reliable with exception of ink pens clogging, jamming, rendering plotter unusable
Executive Summary Cont… • BAD replaces ink pen upon failure of each • Alternative repair by service manager • Replace all 4 ink pens upon one failure • Ideally reducing the frequency of failures
Data Analysis • The following data was provided by the case study: • Total cost of downtime $50/hr • Replacement time of 1 pen = 1 hr/pen • Replacement time of 4 pens 2 hr/set • Cost of each pen $8/pen
Data Analysis Cont… • Probability Distribution Between Failures (each pen replaced as it fails)
Data Analysis Cont… • Probability Distribution Between Failures (4 pens replaced as 1 fails)
Data Analysis Cont… • Additional data (assumptions used in simulation to establish year utilization)
Basis of Simulation • Simulated Brennan’s problem for two options • Case 1 : Replace ink pen as it fails • Case 2 : Replace all four ink pens as one fail • Used “Next Event Increment Model” approach to carry out the simulation • Split runs in “Year (of 2500 hrs each)” this helps in results analysis • Each run is arrested when “close enough” to 2500 hrs. A “While-cycle” would have been best approach. A spreadsheet works well as analysis is simple • Used VLOOKUP to instantaneously look-up probability tables and determine hours between plotter failures
Basis of Simulation Cont… • Computed total time adding downtime to TBF computed from Probability Distribution. • Derived total cost of each failure • Cost of 1 pen plus cost of One hour of downtime (case 1) = 58 $ • Cost of 4 pens plus cost of Two hour of downtime (case 1) = 132 $ • Computed failures for the equivalent of 1 plotter year. Run repeated 5 times (reasonable life-cycle for a plotter).
Simulation: Results Case 2 is the most convenient choice evaluated as an average on a 5-Year simulation.
Analytical Results • A different approach has been followed based on analytical considerations. • The Mean for each distribution has been calculated, i.e. MTBF. • We calculated number of failures X year as: • Numb. Fail. X Year= 2500 / (MTBF + MT) • We calculated costs in 1 Year as: • 1 Y Cost = [Numb. of Fail. X Year] * [Repairing Costs] • NOTE: Tot. Cost = [1 Y Cost] * [N Year]
Analytical Solution: Results Best Choiche is again Case 2. Note how close Analytical and Simulated results are evaluated as an average on a 5 Y time frame.
Conclusion • Based on the results achieved with the .xls simulation we observed the progression of costs and maintenance times • Determined that in Case 2, replacement of all 4 pens upon one failed pen, will minimize maintenance costs for BAD • Analytical results reinforce our simulated study that Case 2 is indeed the best policy to implement. (or viceversa?)