Download
1 / 82
820 likes | 988 Views
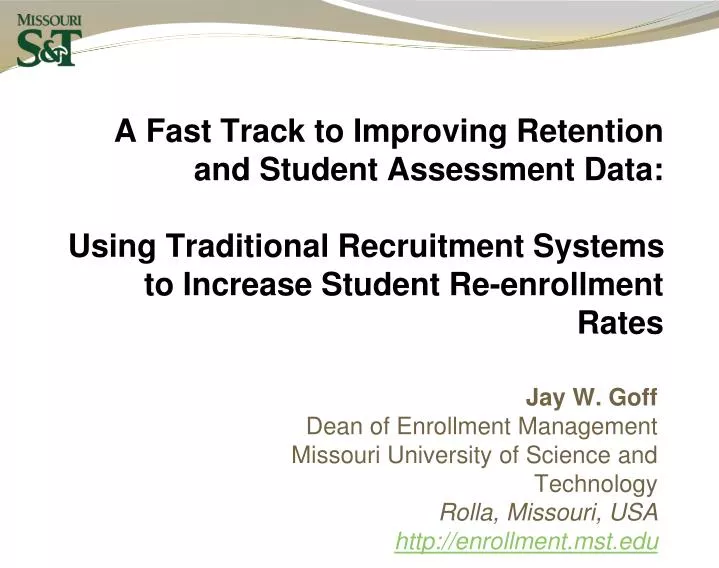
A Fast Track to Improving Retention and Student Assessment Data: Using Traditional Recruitment Systems to Increase Student Re-enrollment Rates. Jay W. Goff Dean of Enrollment Management Missouri University of Science and Technology Rolla, Missouri, USA http://enrollment.mst.edu.

E N D
A Fast Track to Improving Retention and Student Assessment Data: Using Traditional Recruitment Systems to Increase Student Re-enrollment Rates Jay W. Goff Dean of Enrollment Management Missouri University of Science and Technology Rolla, Missouri, USA http://enrollment.mst.edu
Direct Mail E-Mail Internet/Websites Social Networking Sites: MySpace or Facebook Phone Calling or Telecounseling Admissions’ Multi-Media Resources
3% (25-35 students) gain from multi-media outreach First year: $162,500 to $227,500 USD Fourth year: $650,000 to $910,000 USD The Price of Retention Success
Students dropped for non-payment 2002: +400, 2007: 48 1-3% instant gain in retention $128,000 additional net tuition revenue Minority and First Gen Students Cohorts to Focus On
Communications patterns among teens are shifting as their array of options grows. For the entire population of those ages 12-17, phone conversations and face-to-face meetings are the most frequently chosen ways to communicate with friends outside of school. Multi-channel teens – those teens who use the internet, instant messaging, text messaging a cell phone, and social networking sites – are more likely to turn to cell phones and digital media when communicating with friends. These multi-channel teens are super communicators who will use any tool at their disposal, but cell phones, instant messaging applications, and social networking channels rank higher in the panoply of their communications choices when compared with landline and face-to-face communication outside of school. SOURCE: Teens and Technology, Pew Internet & American Life Project Summary of Findings The landline is still a lifeline for teen social life.
Financial considerations the most common reason for leaving college SOURCE: ELS:2002 “A First Look at the Initial Postsecondary Experiences of the High School Sophomore Class of 2002 (National Center for Education Statistics)
Why Student Leave S&T Personal Reasons: Family issues – needed at home Girlfriend/Boyfriend issues Bad & overpriced dorm & food Too small of a town/Nothing to do Just not the right fit Wanted to get away from home Wanted to move closer to home Academic Issues: Too hard/Grades lower than expected Changed major/preferred at another institution Felt university was too focused on Engineering/Not enough different liberal arts programs/classes Advisor/Instructor not helpful enough Financial Issues: Cost/Financial Cannot borrow enough Parents will not pay Note: Some students reported multiple reasons.
Student Success Trends ACT, 2007
STUDENT RETENTION Graduation Rates 20002005 General Student Body: 52% 64%
Missouri S&T ENROLLMENT33% Growth since 2000Since 2004, 60% of Growth due to Retention Increase
What is Missouri S&T? A Top 50 Technological Research University 6100 students: 4700 Undergrad, 1400 Graduate 90% majoring in Engineering, Science, Comp. Sci. Ave. Student ACT/SAT: upper 10% in nation +60% of Freshmen from upper 20% of HS class 20% Out of State Enrollment 96% 5 Year Average Placement Rate within 3 months of Grad Ave. Starting Salary in 2007: +$53,000
2008 National Academic and Outcomes Rankings F o u n d e d 1 8 7 0 R o l l a , M i s s o u r i
U.S. News: Best colleges as ranked by the high school counselors at America’s Top 800 high schools: • Missouri S&T ranked 45th Overall • #12 public university • Ahead of, or tied with, every “Big 12” institution • #5 technological research university • #2 in Missouri behind Washington Univ in St. Louis
A Top Public University Missouri S&T ranked 54th among the nation’s top public universities (U.S. News & World Report, 2008 America’s Best Colleges Guidebook, September 2008). Top 15 Public Colleges for Getting Rich #1 in the Midwest! Missouri S&T ranked 12th on Forbes magazine’s list of “Best Public Colleges for Getting Rich” (www.forbes.com, Aug. 2008) Top 20 STEM Research University Missouri S&T named in Academic Analytics’ “Top 20 Specialized Research Universities - STEM” (www.academicanalytics.com, Jan. 2008) Top 25 Starting Salaries #1 in the Midwest! Missouri S&T named in payscale.com’s list of highest average starting salaries for graduates (www.payscale.com, Aug. 2008) Top 25 Entrepreneurial Campus Missouri S&T ranked 22nd on Forbes ‘s list of “America’s Most Entrepreneurial Campuses” (www.forbes.com , Oct. 22, 2004). Top 25 Connected Campus Missouri S&T named in Princeton Review’s “America’s 25 Most Connected Campuses” (www.forbes.com, Jan. 19, 2006). Top 30 Safest College Campuses Missouri S&T ranked #27 in Reader’s Digest’s “Campus Safety Survey” (www.rd.com, 2008). Top 50 Engineering School Missouri S&T ranked 48th among the nation’s best engineering schools (U.S. News & World Report, 2007 America’s Best Colleges Guidebook, September 2006). Top 65 Public Educational Value Missouri S&T ranked 62nd among America’s public universities by Kiplinger.com’s “2008 Best Values in Education,” (www.kiplinger.com, 2008).
Student Interest Trends in Engineering (<5%) SOURCE: ACT, 2006
Life as a National Outlier Average enrollment is 6,457 Average enrollment is 5,615
ALASKA RI DE DC MD Legend 50 or more students 10 – 49 students 1 - 9 students No students SO. CAROLINA Geographic Distribution by Students’ Home States WASHINGTON 62 MAINE NORTH DAKOTA MINNESOTA MONTANA 4 1 OREGON VT 18 3 2 WISCONSIN NH 5 13 IDAHO 12 SOUTH DAKOTA 3 MA 15 5 NEW YORK CT MICHIGAN WYOMING 2 16 5 2 PENNSYLVANIA IOWA 12 NEVADA 26 NEBRASKA NJ OHIO 43 5 IN UTAH ILLINOIS 18 15 10 395 WV 4 COLORADO VIRGINIA 16 4 DC 2 KANSAS 20 12 MISSOURI 137 KENTUCKY CALIFORNIA 4,321 17 59 NO. CAROLINA TENNESSEE 5 59 ARIZONA OKLAHOMA ARKANSAS NEW MEXICO 12 61 5 3 MS GEORGIA ALABAMA 8 11 12 LA TEXAS 13 110 3 12 FL All Students, Totals United States 5,605 Other Countries 564 Total 6,167 HAWAII 1 Armed Forces Pacific & Africa 3 PUERTO RICO 1 Note: Geographic Origin is defined as student's legal residence at time of original admission to S&T. Source: Integrated Postsecondary Education Data System (IPEDS) frozen files, end of 4th week of classes. Revised 9-24-2007.
Average Age: 21.6 years old Gender: 23% Female 77% Male First Generation College Students: 2005-06: 37% Residency: Missouri Residents: 76% Out-State Students: 22% International: 2% Ethnicity: African-American: 4% Asian-American: 3% Caucasian: 83% Hispanic: 2% Native-American: 1% Non-resident, International: 2% Not Disclosed: 5% First Generation: 36% From a Community <40,000: 55% approx. Average Family Income: $72,000 Average Indebtedness at Graduation: $21,000 USD approx. High Financial Need (Pell qualifier): 24% Freshmen with Credit Cards: 24% Students with PCs: 94% +70% laptops 7% Macs Students with Cell Phones 97% Undergraduate Demographics
How Did Missouri S&T Make Immediate Gains in Retention and Graduation Rates?
STEP ONE: Identify the Problem Using the Scientific Process
New Student Survey (prior to start of classes) Withdrawal Survey (prior to cancelling classes) Phone/Email Survey of Non-Returning Students (2-4 weeks prior to start of semester) Student Satisfaction Survey (all returning students) Graduating Student Survey (prior to commencement or within the first six months after graduating) Core Retention Assessments:Knowing Why Students Chose your Campus, Stayed or Left
Re-designing the bills to be easier to read: use a credit card model and provide on-line access Re-write Academic Warning Letters Postcards for Families: Important Dates, Parents’ Association, etc. Direct Mail
Send students information you know they need, but NOT TOO OFTEN Do not send more than one e-mail every three to four weeks. E-mail
Success Chain: Focusing Student Support Programs on the Students Most Likely to Need Them
Create a Help Page for Students and Parents Make sure your search engine is geared to identify key webpages based on the student’s need (i.e. scholarships, financial aid, tutoring, suicide, depression, I need help, etc.) Make sure that all student service pages include the names and contact info for the staff and faculty! Internet – Homepages – Social Networks
E-Birthday Cards Identify students interests Promote events and services Social Networks(Facebook, MySpace, Friendster, etc.)
2-6% immediate improvement reported Great data and problem identification tool Relatively low expense Phone Calls / Telecounseling
Summarizing the non-returning freshmen data 2001-2007 The average student leaving is a good a student: ACT: upper 20% in nation, High School Class Rank: upper 25% The non-returning students scored on average 1.16 points lower than those returning students on the ACT (range is 0.6-1.8) Non-returnees averaged 8.8 percent lower in class rank than their staying counter parts (range is 7.5 to 10.5) Non-returnees scored on average .24 points lower in HS GPA (range is .21 - .25) Non-returnees earned an average GPA of .775 lower than their returning counterparts (range is .64 - .86) Non-returnees also averaged almost a full point lower GPA when compared to their HS GPA while their counterparts averaged less than a .5 drop from their HS GPA to their GPA.
Common Themes 2001-2007 Why did you leave? Changed majors Financial / too expensive Low Grades Rolla is boring / too small
Do you plan to return to S&T? 68% students do not plan to return to S&T 25% plan to return (“Stop-outs”: this includes students leaving for military service) 7% were not certain of their plans
What would have kept you at S&T? “Nothing would have kept me at S&T” More money or financial aid More majors or non-engineering degrees Higher or better grades
Would you recommend S&T to another student? 38% would recommend to another student unconditionally 39% would recommend for engineering/science/math only 4% would recommend with a caveat (it’s not for everyone, if they wanted to go away) 5% said no
2-8 weeks prior to start of semester/quarter Follow-up calling after the official census date Calling Schedule
USE STAFF!!! Preferably a staff member with the ability to re-admit and re-enroll the student Staff vs. Student Callers
Highlights the results of the Spring 2007 and Fall 2007 Phone Survey Survey involves Retention of First-Time Full-Time Degree Seeking Freshmen Students Annual Retention Audit Report
Registrar:Prepares list of degree-seeking, non-registered FS06 first-time, full-time Freshmen. Develop spreadsheet calling list:Student’s name, email, phone #, hometown, major, S&T GPA Make Telephone calls:Best contact times were from 10 am – 2 pm or 6 to 8 pm Emails:Initially sent to students with incorrect or no phone numbers and students who we could not reach by phone. Follow-up: Follow-up thank you letter sent to contacted students Compile results:Prepared an overview PowerPoint Submit results:PowerPoint was submitted to the Dean of Enrollment Management and Vice Provost of Undergraduate Studies Retention Report Process
Total Fall 2006 first-time full-time degree-seeking students was 935. 32 (3.4%) did not return for the Spring 2007 term. 67 (7.1%) did not return for the Fall 2007 term. 14 students didn’t return due to academic deficiency 5 students withdrew during the Spring 2007 semester 4 students were enrolled at time of calling but were cancelled due to non-payment 2 students were going on a 2-year mission trip and then returning to S&T. For purposes of this survey, they were not counted as non-returning. 1 student was deceased – New cohort data is 934 First-Time Full-Time Degree-Seeking Students 1 of the 32 students re-enrolled for Fall 2007 First Year Retention Rate: 87%
Freshmen Retention After One and Six years • Status in Fall Semester After One Year • Status in Fall Semester After Six Years Numbers are all in percentages. Due to rounding, percents may not sum to 100%
Full-time, Degree Seeking FreshmenRetention after One and Six years