Download
1 / 14
140 likes | 234 Views
Modeling the Human Classification of Galaxy Morphology. Wednesday, December 5, 2007 Mike Specian. Galaxy Zoo Statistics. Site announced on July 15, 2007 Over 50,000 volunteers within first week Most galaxies classified 10 times or more More classifications = better data

E N D
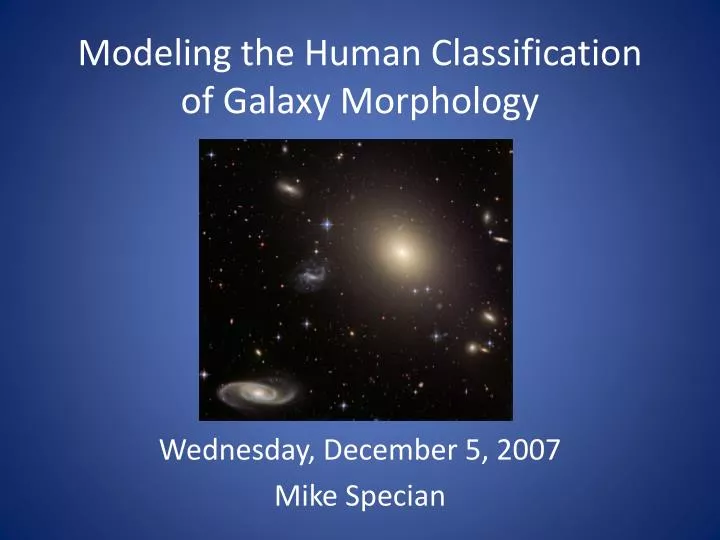
Modeling the Human Classification of Galaxy Morphology Wednesday, December 5, 2007 Mike Specian
Galaxy Zoo Statistics • Site announced on July 15, 2007 • Over 50,000 volunteers within first week • Most galaxies classified 10 times or more • More classifications = better data • Probably world’s most robust morphology database with millions of objects classified
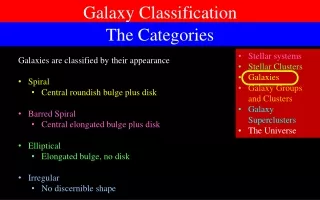
Data Preprocessing • 1, 11 = Elliptical • 2, 12 = Clockwise Spiral • 3, 13 = Counterclockwise Spiral • 4, 14 = Other (Edge-On Spiral) • 5, 15 = Star / Don’t-Know • 6, 16 = Galaxy Merger
How People Voted There’s almost too much data! Limiting the sample: Model on 10,000 objects Distinguish only between ‘Elliptical’ and ‘Spiral’ Accept objects that received >= 60% of the total vote
Two Data Sets Set 1 Only contains information that human eyes could use to distinguish morphology. (30 attributes) Examples: Petrosian flux, Petrosianradius, radius containing 50% and 90% of Petrosian flux, Adaptive Shape Measures, DeVaucouleurs fits, Exponential fits Set 2 Contains additional information likely correlated to morphology, but for which human eyes on Galaxy Zoo do not have access. (71 attributes) Examples: Light polarization (Stokes parameters), DeVaucouleurs magnitude fits, dereddened magnitudes, redshift For Set 1 all categories are measured in the telescope’s three visible color filters. For Set 2, all, save redshift, are measured with all 5 filters. Feature data pulled from Sloan Digital Sky Survey Data Release 6
How many trees inan ideal random forest? Accuracies above trained on 2179 instances, ~50/50 spiral/elliptical, 66% holdout
Probing Learning Rate andMomentum in ANN To 3 Sigma -> Accuracies above trained on 2179 instances, ~50/50 spiral/elliptical, 66% holdout
Quantifying Estimator Error Average = 95.6 Standard Deviation = 0.158 All errors taken to 3 sigma. Error = 95.6 0.5 Example taken from Random Forest, Data Set 2, 15 Trees
Conclusions • Naïve Bayes is not the way to go. • Random Forests, ANN, and SVM all have small variances, high accuracies • Spirals harder to identify (need more training instances, or has human bias taken over?) • Including information beyond what the human eye can see is, remarkably, helpful.