Download
1 / 53
530 likes | 660 Views
Kansas School Health Profiles 2006 Results. For more information, please visit www.kshealthykids.org. Background. Centers for Disease Control & Prevention Division of Adolescent and School Health National Center for Chronic Disease Prevention and Health Promotion. Background.

E N D
Kansas School Health Profiles 2006 Results For more information, please visit www.kshealthykids.org
Background • Centers for Disease Control & Prevention • Division of Adolescent and School Health • National Center for Chronic Disease Prevention and Health Promotion
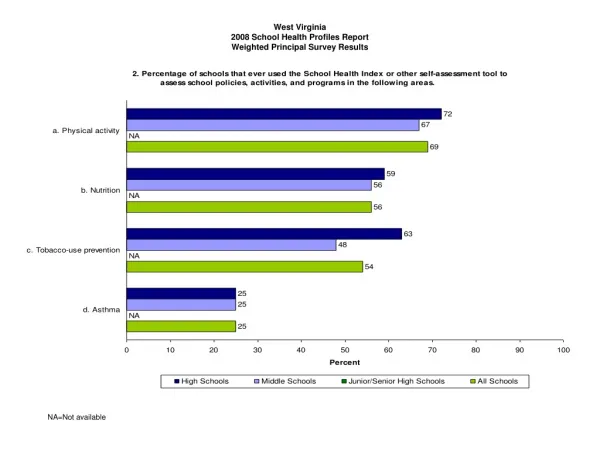
Background Used to monitor and assess characteristics of and trends in schools in the following areas: • Health Education • Physical Education • Asthma Management Activities • School health Policies Related to HIV/AIDS • Tobacco-use Prevention • Violence Prevention • Physical Activity • Nutrition • Food Service • Family & Community Involvement in School Health Programs
Survey Instrument • Two Questionnaires • Principal • Lead Health Education Teacher
Sampling Parameters • January – May 2006 • 327 Secondary Public Schools • Grades 6-12 • Response Rate • 78% Principals • 75% Teachers
Kansas Coordinated School Health2006 School Health Profiles ReportWeighted Principal Survey Results
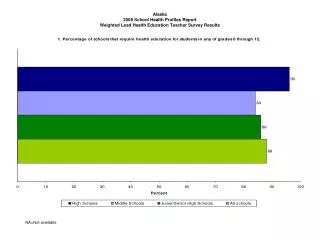
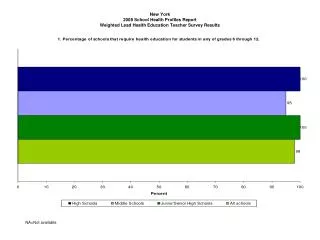
Kansas Coordinated School Health 2006 School Health Profiles ReportWeighted Principal Survey Results *Among those schools that require health education for students in any of grades 6 through 12.
Kansas Coordinated School Health2006 School Health Profiles ReportWeighted Principal Survey Results *Among those schools that require health education for students in any of grades 6 through 12.
Kansas Coordinated School Health2006 School Health Profiles ReportWeighted Principal Survey Results *Among those schools that require health education for students and students take one or more required health education courses in any of grades 6 through 12.
Kansas Coordinated School Health2006 School Health Profiles ReportWeighted Principal Survey Results
Kansas Coordinated School Health2006 School Health Profiles ReportWeighted Principal Survey Results *Among those schools that require physical education for students in any of grades 6 through 12.
Kansas Coordinated School Health2006 School Health Profiles ReportWeighted Principal Survey Results *Among those schools that require physical education for students in any of grades 6 through 12.
Kansas Coordinated School Health2006 School Health Profiles ReportWeighted Principal Survey Results
Kansas Coordinated School Health2006 School Health Profiles ReportWeighted Principal Survey Results *Among those schools that offer students opportunities to participate in intramural activities or physical activity clubs.
Kansas Coordinated School Health2006 School Health Profiles ReportWeighted Principal Survey Results
Kansas Coordinated School Health2006 School Health Profiles ReportWeighted Principal Survey Results
Kansas Coordinated School Health2006 School Health Profiles ReportWeighted Principal Survey Results *Among schools that serve lunch to students.
Kansas Coordinated School Health2006 School Health Profiles ReportWeighted Principal Survey Results
Kansas Coordinated School Health2006 School Health Profiles ReportWeighted Principal Survey Results
Kansas Coordinated School Health2006 School Health Profiles ReportWeighted Principal Survey Results *Among those schools where students can purchase snack foods or beverages from one or more vending machines at the school or at a school store, canteen, or snack bar.
Kansas Coordinated School Health2006 School Health Profiles ReportWeighted Principal Survey Results *Among those schools where students can purchase snack foods or beverages from one or more vending machines at the school or at a school store, canteen, or snack bar.
Kansas Coordinated School Health2006 School Health Profiles ReportWeighted Principal Survey Results *Among those schools where students can purchase snack foods or beverages from one or more vending machines at the school or at a school store, canteen, or snack bar.
Kansas Coordinated School Health2006 School Health Profiles ReportWeighted Principal Survey Results *Among those schools where students can purchase snack foods or beverages from vending machines at the school or at the school store, canteen, or snack bar.
Kansas Coordinated School Health2006 School Health Profiles ReportWeighted Principal Survey Results
Kansas Coordinated School Health2006 School Health Profiles ReportWeighted Principal Survey Results
Kansas Coordinated School Health2006 School Health Profiles ReportWeighted Lead Health Education Teacher Survey Results *Among those schools that require a health education course for students in any of grades 6 through 12.
Kansas Coordinated School Health2006 School Health Profiles ReportWeighted Lead Health Education Teacher Survey Results
Kansas Youth Risk Behavior Survey 2005 Results For more information, please visit www.kshealthykids.org
Background • Centers for Disease Control & Prevention • Division of Adolescent and School Health
Background Used to measure behaviors that fall into six categories: • Behaviors that result in unintentional injuries and violence • Tobacco use • Alcohol and other drugs • Sexual behaviors that result in HIV infection, other sexually transmitted disease, and unintentional pregnancies • Dietary behaviors • Physical activity
Survey Instrument • Self-administered • Anonymous • 87 question survey
Sampling Parameters • January – May 2005 • 1,654 students in 41 public high schools • Response Rate • 82% for schools • 88% for students
Kansas High School Survey Summary Graphs Number of students in a class of 30 who: Never or rarely wore a seatbelt when riding in a car 4.4 Rode with a driver who had been drinking alcohol during the past 30 days 8.8 Carried a weapon during the past 30 days 4.9 Attempted suicide during the past 12 months 2.0 Smoked cigarettes during the past 30 days 6.3 Drank alcohol during the past 30 days 13.2 Used marijuana during the past 30 days 4.7 Ever had sexual intercourse 13.4 Did not participate in vigorous physical activity three or more days during the past seven days 9.2 Did not attend PE class daily 21.7 Were overweight* 3.6 Did not eat five or more fruits and vegetables per day 23.8 0 10 20 30 Weighted Data *See the corresponding summary table for detailed explanation of data.
Kansas High School Survey Summary Graphs Percentage of students who: Never or rarely wore a seatbelt when riding in a car 14.7 Rode with a driver who had been drinking alcohol during the past 30 days 29.2 Carried a weapon during the past 30 days 16.2 Attempted suicide during the past 12 months 6.5 Smoked cigarettes during the past 30 days 21.0 Drank alcohol during the past 30 days 43.9 Used marijuana during the past 30 days 15.6 Ever had sexual intercourse 44.8 Did not participate in vigorous physical activity three or more days during the past seven days 30.5 Did not attend PE class daily 72.2 Were overweight* 11.9 Did not eat five or more fruits and vegetables per day 79.4 0 20 40 60 80 100 Weighted Data *See the corresponding summary table for detailed explanation of data.
Kansas High School Survey Percentage of students who were at risk for becoming overweight (i.e., at or above the 85th percentile but below the 95th percentile for body mass index, by age and sex)* 100 80 60 40 16.9 14.5 13.6 12.9 20 13.3 11.5 10.4 0 Total Males Females 9th 10th 11th 12th *QNROVWGT - Weighted Data - Based on reference data from the National Health and Nutrition Examination Survey I.
Kansas High School Survey Percentage of students who were overweight (i.e., at or above the 95th percentile for body mass index, by age and sex)* 100 80 60 40 14.7 14.7 12.5 11.2 20 11.9 8.8 8.8 0 Total Males Females 9th 10th 11th 12th *QNOVWGT - Weighted Data - Based on reference data from the National Health and Nutrition Examination Survey I.
Kansas High School Survey Percentage of students who drank 100% fruit juices one or more times during the past seven days 100 81.1 77.5 80.0 79.0 79.0 78.3 79.2 80 60 40 20 0 Total Males Females 9th 10th 11th 12th QN71 - Weighted Data
Kansas High School Survey Percentage of students who ate fruit one or more times during the past seven days 100 89.5 86.6 87.7 86.7 87.7 87.5 87.7 80 60 40 20 0 Total Males Females 9th 10th 11th 12th QN72 - Weighted Data
Kansas High School Survey Percentage of students who ate five or more servings per day of fruits and vegetables during the past seven days 100 80 60 40 24.3 22.4 21.5 18.6 20.6 18.5 17.8 20 0 Total Males Females 9th 10th 11th 12th QNFRVG - Weighted Data
Kansas High School Survey Percentage of students who drank three or more glasses per day of milk during the past seven days 100 80 60 40 24.2 20.7 19.9 17.8 15.9 14.5 20 11.1 0 Total Males Females 9th 10th 11th 12th QN77 - Weighted Data
Kansas High School Survey Percentage of students who exercised or participated in physical activity that made them sweat and breathe hard for 20 minutes or more on three or more of the past seven days 100 77.1 74.9 70.6 80 66.4 69.5 64.0 63.2 60 40 20 0 Total Males Females 9th 10th 11th 12th QN78 - Weighted Data
Kansas High School Survey Percentage of students who participated in physical activity that did not make them sweat or breathe hard for 30 minutes or more on five or more of the past seven days 100 80 60 40 28.8 29.0 26.1 25.7 24.9 26.3 23.5 20 0 Total Males Females 9th 10th 11th 12th QN79 - Weighted Data
Kansas High School Survey Percentage of students who had not participated in at least 20 minutes of vigorous physical activity on three or more of the past seven days and had not participated in at least 30 minutes of moderate physical activity on five or more of the past seven days 100 80 60 28.5 32.7 40 32.0 26.5 27.0 22.2 20.8 20 0 Total Males Females 9th 10th 11th 12th QNMINPA - Weighted Data
Kansas High School Survey Percentage of students who had not participated in any vigorous or moderate physical activity during the past seven days 100 80 60 40 20 11.0 9.8 9.0 9.5 8.3 8.9 6.1 0 Total Males Females 9th 10th 11th 12th QNNOPA - Weighted Data
Kansas High School Survey Percentage of students who were physically active for a total of 60 minutes or more per day on five or more of the past seven days 100 80 60 49.9 46.8 42.1 36.8 41.3 38.4 32.4 40 20 0 Total Males Females 9th 10th 11th 12th QN80 - Weighted Data
Kansas High School Survey Percentage of students who attended physical education (PE) classes on one or more days in an average week when they were in school 100 82.6 80 65.2 55.5 47.2 60 45.0 44.5 45.2 40 20 0 Total Males Females 9th 10th 11th 12th QN82 - Weighted Data
Kansas High School Survey Percentage of students who attended physical education (PE) classes daily in an average week when they were in school 100 80 41.5 60 36.5 40 27.8 24.8 23.7 19.9 19.0 20 0 Total Males Females 9th 10th 11th 12th QNDLYPE - Weighted Data
Kansas High School Survey Among students enrolled in physical education (PE) class, the percentage who actually exercised or played sports more than 20 minutes during an average PE class 90.9 100 91.8 93.0 91.2 89.8 90.3 88.4 80 60 40 20 0 Total Males Females 9th 10th 11th 12th QN83 - Weighted Data