Download
1 / 29
290 likes | 425 Views
Enceladus water jet models from UVIS star occultations. 2 April 2013. UVIS Observations of Enceladus’ Plume. Feb. 2005 - lambda Sco No detection (equatorial) July 2005 - gamma Orionis Composition, mass flux Oct. 2007 - zeta Orionis Gas jets May 2010 - Sun

E N D
Enceladus water jet models from UVIS star occultations 2 April 2013
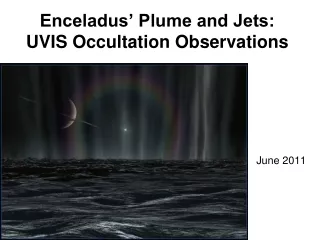
UVIS Observations of Enceladus’ Plume • Feb. 2005 - lambda Sco • No detection (equatorial) • July 2005 - gamma Orionis • Composition, mass flux • Oct. 2007 - zeta Orionis • Gas jets • May 2010 - Sun • Composition, jets • Oct. 2011 – eps and zeta Orionis dual occultation UVIS observes occultations of stars and the sun to probe Enceladus’ plume Composition, mass flux, and plume and jet structure Four stellar and one solar occultation observed to-date
Plume Composition is Water Vapor I=I0 exp (-n*) I0 computed from 25 unocculted samples n = column density = absorption cross-section, function of wavelength The absorption spectrum of water is shown compared to Enceladus’ plume spectrum (I/I0) for a water column density of n = 1.5 x 1016 cm-2
Estimation of Enceladus Water Flux • S = flux = N * h2 * v = n/h * h2 * v = n * h * v Where N = number density / cm3 h2 = area v = velocity n = column density measured by UVIS Estimate h from plume dimension, = 80 km Estimate v from thermal velocity of water molecules in vapor pressure equilibrium with warm ice (600 m/sec for surface temperature ~ 180K – note that escape velocity = 230 m/sec) h v S = 1.5 x 1016 * 80 x 105 * 60 x 103 = 0.7 x 1028 H2O molecules / sec = 200 kg / sec
2005 - gamma Orionis Occultation 2010 - Solar Occultation The Occultation Collection 2007 - zeta Orionis Occultation 2011 occ was a horizontal cut through the plume also
Can we detect Ethylene in Enceladus’ Plume? • INMS detects a species with atomic mass = 28 • Previously thought that this must be CO or N2 • New idea (consistent with other INMS data) is that it could be ethylene • C2H4 = 2 * 12 + 4 = 28
Ethylene at 3% H2O Column Density is not detectable by UVIS • Rev 11 gamma Orionis occultation • Ethylene plus water • C2H4 column density = 4.8 x 1014 cm-2 • H2O column density = 1.6 x 1016 cm-2
Plume Structure (2005) Water vapor abundance calculated from each 5 sec spectrum. The 2005 water profile is best fit by an exponential curve. The best fit scale length is 80 km
Optical Depth vs. Rayheight (2007) Minimum distance of rayheight above limb = 15.6 km S/C velocity = 22.57 km/sec Best fit is tau = 64.4 x z-2.33 - 0.007 Density at jets is ~2x higher than “background” plume
2007 High Speed Photometer (HSP) Data • HSP is sensitive to 1140 to 1900Å • Statistical analysis finds features that are statistically unlikely • Assumes signal is Poisson distribution • Compares to running mean • Six different bin sizes employed, absorptions compared, persistence of feature is part of test • m is the number of such events one would expect to occur by chance in the data set • m<<1 are likely to be real events Possible real features: 1 (a) m = 0.032 2 (b) m = 0.000008 3 (c) m = 0.00056 6 (d) m = 0.026
Groundtrack of Ray 2005 2007
Enhanced HSP absorption featuresa, b, c, and d can be mapped to dust jets located by Spitale and Porco (2007) along the tiger stripes
a b c d Absorption Features, Compared to Dust Jet Locations Plotted here are: • Altitude above Enceladus' limb of the line-of-sight from Cassini to the star • Attenuation of the HSP signal, scaled by a factor of 300 • Projections of the 8 jets seen by the ISS into the plane of the figure • Jets assigned a length of 50 km (for purposes of illustration) • C/A marks the closest approach of the line-of-sight to Enceladus. • The times and positions at which the line-of-sight intersected the centerlines of the jets are marked by squares. The slant of the jets at Baghdad (VII) and Damascus (III) contribute to the overall width of the plume
Plume or jets? • The plume of gas and dust from Enceladus includes a number of individual jets seen by Cassini camera and by UVIS
Gas Jets are idealized as sources along the line of sight with thermal and vertical velocity components • Source strength is varied to match the absorption profile. • The ratio of thermal velocity (vt) to vertical velocity (vb) is optimal at vt / vb = 0.65. • Higher thermal velocities would cause the streams to smear together and the HSP would not distinguish the two deepest absorptions as separate events. • At least 8 evenly-spaced gas streams are required to reproduce the overall width of the absorption feature (there may be more). Gas Jet Model Key Result: Vthermal / Vbulk = 0.65 Flow is supersonic
Best fit of 8 sources from Spitale & Porco to match UVIS occultation profile
Brightness of water vapor over Enceladus South pole from UVIS 8-jet model
Orion’s Belt Dual Occ Geometry • Dual stellar occ by Enceladus’ plume, E15, 19 October 2011, epsilon Orionis (blue) and zeta Orionis (white) • Horizontal cut through plume
Rev 155 Enceladus Dual Occultation • Eps Ori (Alnilam, B) • 16.5 km at closest point • HSP centered on eps Ori • Dimmer star • Zeta Ori (Alnitak, O) • 37.9 km at closest point • Observed with UVIS Far Ultraviolet channel (FUV: 1115 to 1915 Å) and High Speed Photometer (HSP) • Water vapor absorbs star signal in the FUV
Plume Model for E7 • We still do not have enough measurements to determine all model parameters [only 2 occ’s] • Spacecraft trajectory uncertainty of 1 sec or less [= 20km] can make jet identification uncertain • Prediction for 100km altitude: 1.1x10⁹ for Mach3, uncertain due to unknown eruption velocity
Estimate of Water Flux from Enceladus = 200 kg/sec S = flux = N * x * y * vth = (n/x) * x * y * vth = n * y * vth Where N = number density / cm3 x * y = area y = vlos * t => FWHM vth = thermal velocity = 45,000 cm/sec for T = 170K n = column density measured by UVIS 2011: vlos = 7.48 km/sec x v
f e a b d c The Jets 2007 2010 • In the past we have identified collimated jets of gas from enhanced absorption features in the HSP (2007 zeta Ori occ) and the EUV (2010 solar occ) • This time the HSP data was lower snr • no features passed the rigorous statistical tests applied • Unlike 2007 zeta Orionis occ • Rely on FUV data, cross-correlation of absorptions in same place / shifted in time
All Groundtracks Basemap from Spitale & Porco, 2007 Zeta Ori 2011 • Blue => zeta Orionis 2007 • Red => Solar occ 2010 • Green => zeta Orionis 2011 Solar occ In all occultations we look through the plume The groundtrack is the perpendicular dropped to the surface from the ray to the star Zeta Ori 2007
Eps and Zeta Orionis Comparison • Damascus jets (DII and DIII) identified • Distinct at eps Ori altitude, merged higher • Clear signal of gas from Baghdad fissure (B-f), though no dust jet nearby • Possible activity at “?” without associated dust jet • Average computed for each star • Then ratios computed for each • Time shifted to align enhanced absorption feature at B-f because geometry clearly correlated with fissure-crossing ? B-f DIII DII
HSP • HSP targeted to eps Ori • 0.008 sec integration summed to 1 sec • Although features did not pass our statistical tests we can compare to the FUV data set • Good agreement with eps Ori ? Baghdad Damascus a b c
Summary of Results: PLUME • Attenuation in HSP data ~10% in 2007, ~6% in 2005 • Opposite of Hurford et al modelof fissures opening and closing • Plume column density goes as ~ z-2 or as exp(-z/H) (z is minimum rayheight) • Water vapor flux ~200 kg/sec • No detection of CO, upper limit 3% (3 sigma)
Summary of Results: JETS • 2007 HSP data shows 4 features with m < 0.1 (probability of chance occurrence). Typical half-width: 10 km at z = 15 km. • Gas jets can be correlated with dust jets mapped in images on Cairo, Alexandria, Damascus and Baghdad tiger stripes • Jet opacity corresponds to vapor density doubled within jets • Alternate explanation: no excess gas, with all increase due to dust. Then, dust opacity peaks at 0.05 in the jets. This would give 50x more mass in dust compared to vapor within the jet. • Ratio of thermal velocity to vertical velocity in jet = 0.65 • Gas is supersonic: Mach 1.5 • Eight or more jets required to reproduce width and shape of absorption, some evidence for diffuse sources • Jet source area is smaller than 300 m x 300 m
Summary • Mass flux determined, compared to other occs • Jets tougher to identify because low snr • HSP data did not pass statistical tests • Determination of spreading at the two altitudes also limited by temporal resolution of the FUV (2 sec integration time) • 2 sec x 7.48 km/sec line-of-sight velocity = 15 km • That is the approx. width of the jets derived in earlier occultations • Work in progress!