Download
1 / 38
380 likes | 557 Views
Decision theory and Bayesian statistics. More repetition . Tron Anders Moger 22.11.2006. Overview. Statistical desicion theory Bayesian theory and research in health economics Review of previous slides. Statistical decision theory.

E N D
Decision theory and Bayesian statistics. More repetition Tron Anders Moger 22.11.2006
Overview • Statistical desicion theory • Bayesian theory and research in health economics • Review of previous slides
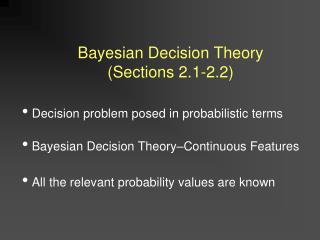
Statistical decision theory • Statistics in this course often focus on estimating parameters and testing hypotheses. • The real issue is often how to choose between actions, so that the outcome is likely to be as good as possible, in situations with uncertainty • In such situations, the interpretation of probability as describing uncertain knowledge (i.e., Bayesian probability) is central.
Decision theory: Setup • The unknown future is classified into H possible states of nature: s1, s2, …, sH. • We can choose one of K actions: a1, a2, …, aK. • For each combination of action i and state j, we get a ”payoff” (or opposite: ”loss”) Mij. • To get the (simple) theory to work, all ”payoffs” must be measured on the same (monetary) scale. • We would like to choose an action so to maximize the payoff. • Each state si has an associated probability pi.
Desicion theory: Concepts • If action a1 never can give a worse payoff, but may give a better payoff, than action a2, then a1 dominates a2. • a2 is then inadmissible • The maximin criterion for choosing actions • The minimax regret criterion for choosing actions • The expected monetary value criterion for choosing actions
Example states actions
Maximin and minimax • Maximin: Maximize the minimum payoff: • For each row, compute the minimum • Maximize over the actions • Minimax regret: Minimize the maximum regret possible • Compute the regrets in each column, by finding differences to max numbers • Maximize over the rows • Find action that minimizes these maxima.
Example Find that action C is preferred under the maximin criterion Regret table: states actions Action C is also preferred under the minimax criterion
Expected monetary value criterion • Need probabilities for each state • Assume P(no outbreak)=P1=95%, P(small outbreak)=P2=4.5%, P(pandemic)=P3=0.5% • EMV(A)=P1*M11+P2*M12+P3*M13= 0*0.95-500*0.045-100000*0.005= -522.5 • EMV(B)=-55.45 • EMV(C)=-1000 • Should choose action B
Decision trees • Contains node (square junction) for each choice of action • Contains node (circular junction) for each selection of states • Generally contains several layers of choices and outcomes • Can be used to illustrate decision theoretic computations • Computations go from bottom to top (or left to right in the book) of tree
Example: No outbreak (0.95) 0 Action A Small outbreak (0.045) -500 Pandemic (0.005) EMV=-522.5 -100000 No outbreak (0.95) EMV=-55.45 -1 *Action B Small outbreak (0.045) -100 Pandemic (0.005) -10000 No outbreak (0.95) EMV=-1000 -1000 Small outbreak (0.045) -1000 Action C Pandemic (0.005) -1000
Updating probabilities by aquired information • To improve the predictions about the true states of the future, new information may be aquired, and used to update the probabilities, using Bayes theorem. • If the resulting posterior probabilities give a different optimal action than the prior probabilities, then the value of that particular information equals the change in the expected monetary value • But what is the expected value of new information, before we get it?
Example: • Prior probabilities: P(no outbreak)=95%, P(small outbreak)=4.5%, P(pandemic)=0.5%. • Assume the probabilities are based on whether the virus has a low or high mutation rate. • A scientific study can update the probabilities of the virus mutation rate. • As a result, the probabilities for no birdflu, some birdflu, or a pandemic, are updated to posterior probabilities: We might get, for example:
The new information might affect what action we would take • But not in this example: • If we find out that birdflu virus has high mutation rate, we would still choose action B! • EMV(A)=-5075, EMV(B)=-515.8, EMV(C)=-1000 • If we find out that birdflu virus has low mutation rate, we would still choose action B! • EMV(A)=-104.5, EMV(B)=-11.9, EMV(C)=-1000
Expected value of perfect information • If we know the true (or future) state of nature, it is easy to choose optimal action, it will give a certain payoff • For each state, find the difference between this payoff and the payoff under the action found using the expected value criterion • The expectation of this difference, under the prior probabilities, is the expected value of perfect information
Example: • Found that action B was best using the prior probabilities • However, if there is no outbreak, action A is one unit better than B • Similarily, if there is a pandemic, action C is 9000 units better than B • The expected value of perfect information is then • EVPI=0.95*1+0.045*0+0.005*9000=45.95
Expected value of sample information • What is the expected value of obtaining updated probabilities using a sample? • Find the probability for each possible sample • For each possible sample, find the posterior probabilities for the states, the optimal action, and the difference in payoff compared to original optimal action • Find the expectation of this difference, using the probabilities of obtaining the different samples.
Utility • When all outcomes are measured in monetary value, computations like those above are easy to implement and use • Central problem: Translating all ”values” to the same scale • In health economics: How do we translate different health outcomes, and different costs, to same scale? • General concept: Utility • Utility may be non-linear function of money value
Risk and (health) insurance • When utility is rising slower than monetary value, we talk about risk aversion • When utility is rising faster than monetary value, we talk about risk preference • If you buy any insurance policy, you should expect to lose money in the long run • But the negative utility of, say, an accident, more than outweigh the small negative utility of a policy payment.
Desicion theory and Bayesian theory in health economics research • As health economics is often about making optimal desicions under uncertainty, decision theory is increasingly used. • The central problem is to translate both costs and health results to the same scale: • All health results are translated into ”quality adjusted life years” • The ”price” for one ”quality adjusted life year” is a parameter called ”willingness to pay”.
Curves for probability of cost effectiveness given willingness to pay • One widely used way of presenting a cost-effectiveness analysis is through the Cost-Effectiveness Acceptability Curve (CEAC) • Introduced by van Hout et al (1994). • For each value of the threshold willingness to pay λ, the CEAC plots the probability that one treatment is more cost-effective than another.
Repetition: What is relevant for the exam • Probability theory • Expected values and variance • Distributions • Tests, regression, one-way ANOVA and at least an understanding of two-way ANOVA are all relevant (obviously) • Interpretation of a time-series regression model might also show up • Do not forget how to interpret SPSS output (including graphs and figures)!! • Also, do not forget the chi-square test!!
Conditional probability • If the event B already has occurred, the conditional probability of A given B is: • Can be interpreted as follows: The knowledge that B has occurred, limit the sample space to B. The relative probabilities are the same, but they are scaled up so that they sum to 1.
Probability postulates 3 • Multiplication rule: For general outcomes A and B: P(AB)=P(A|B)P(B)=P(B|A)P(A) • Indepedence: A and B are statistically independent if P(AB)=P(A)P(B) • Implies that
The law of total probability - twins • A= Twins have the same gender • B= Twins are monozygotic • = Twins are heterozygotic • What is P(A)? • The law of total probability P(A)=P(A|B)P(B)+P(A| )P( ) For twins: P(B)=1/3 P( )=2/3 P(A)=1 · 1/3+1/2 · 2/3=2/3
Bayes theorem • Frequently used to estimate the probability that a patient is ill on the basis of a diagnostic • Uncorrect diagnoses are common for rare diseases
Example: Cervical cancer • B=Cervical cancer • A=Positive test • P(B)=0.0001 P(A|B)=0.9 P(A| )=0.001 • Only 8% of women with positive tests are ill
Probability postulates 4 • Assume that the events A1, A2 ,..., An are independent. Then P(A1A2....An)=P(A1)·P(A2) ·.... ·P(An) This rule is very handy when all P(Ai) are equal • The complement rule: P(A)+P( )=1
Example: Doping tests • Let’s say a doping test has 0.2% probability of being positive when the athlete is not using steroids • The athlete is tested 50 times • What is the probability that at least one test is positive, even though the athlete is clean? • Define A=at least one test is positive Complement rule Rule of independence 50 terms
Expected values and variance • Remember the formulas E(aX+b) = aE(X)+b and • How do you calculate expectation and variance for a categorical variable? • For a continuous variable? • How do you construct a standard normal variable from a general normal variable? • Finding probabilities for a general normal variable?
Distributions • Distributions we’ve talked about in detail • Binomial • Poisson • Normal • Approximations to normal distributions? • Other distributions are there just to allow us to make test statistics, but you need to know how to use them
Remember this slide? (This was difficult) • The probabilities for • A: Rain tomorrow • B: Wind tomorrow are given in the following table: Some wind Strong wind Storm No wind No rain Light rain Heavy rain
And this one? • Marginal probability of no rain: 0.1+0.2+0.05+0.01=0.36 • Similarily, marg. prob. of light and heavy rain: 0.34 and 0.3. Hence marginal dist. of rain is a PDF! • Conditional probability of no rain given storm: 0.01/(0.01+0.04+0.05)=0.1 • Similarily, cond. prob. of light and heavy rain given storm: 0.4 and 0.5. Hence conditional dist. of rain given storm is a PDF! • Are rain and wind independent? Marg. prob. of no wind: 0.1+0.05+0.05=0.2 P(no rain,no wind)=0.36*0.2=0.072≠0.1
Think wheat fields! • Wheat field was a bivariate distribution of wheat and fertilizer • Only: Continuous outcome instead of categorical • Calculations on previous incomprehensible slide is exactly the same as we did for the wheat field! • Mean wheat crop for wheat 1 regardless of fertilizer->Marginal mean!! • Mean crop for wheat 1 given that you use fertilizer ->Conditional mean!! (corresponds to mean for a single cell in our field)
Chi-square test: • Expected cell values: Abortion/op.nurses: 13*36/70=6.7 Abortion/other nurses: 13*34/70=6.3 No abortion/op.nurses: 57*36/70=29.3 No abortion/other nurses: 57*34/70=27.7 • Can be easily extendend to more groups of nurses • As long as you have only two possible outcomes, this is equal to comparing proportions in more than two groups (think one-way ANOVA)
We get: • This has a chi-square distribution with (2-1)*(2-1)=1 d.f. • Want to test H0: No association between abortions and type of nurse at 5%-level • Find from table 7, p. 869, that the 95%-percentile is 3.84 • This gives you a two-sided test! • Reject H0: No association • Same result as the test for different proportions in Lecture 4!
In SPSS: Check Expected under Cells, Chi-square under statistics, and Display clustered bar charts!
Next time: • Find some topics you don’t understand, and we can talk about them