Download
1 / 21
210 likes | 287 Views
This research explores defining and optimizing monitoring configurations for enhanced service delivery in IT environments. It delves into predictive rule generation, rule-based predictors, and evaluating waiting times for rules. The study involves experimental analysis on real alert and ticket data from production servers, aiming to streamline problem detection and resolution processes.

E N D
Defining Monitoring Configurations for Better Service Delivery Cost Liang Tang1, Larisa Shwartz2, Genady Grabarnik3, Florian Pinel2, Tao Li1 1 School of Computer Science Florida International University Miami, FL, USA,2T.J.Watson Research Center, IBM , 3St. John’s University, Department of Mathematics and Computer Science
2 Content • Background • Description Of The Problem Settings And Some Notations Used In The Presentation • Related Work • Constructing Predictive Rules For Non- Actionable Alerts • System, Method And Life Cycle • Predictive Rules • Predictive Rule Generation • Predictive Rule Selection • Why Choose A Rule Based Predictor • Calculating Waiting Time For Each Rule • Evaluation • Experimental Studies On The Real Alert Event And Ticket Data Obtained From Production Servers • Conclusion And Future Work
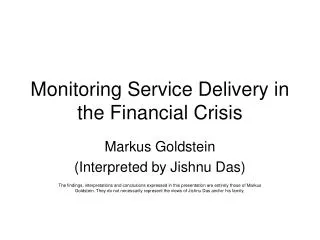
3 Customer Server Applications Enterprise Console Background • The typical workflow of problem detection, determination, and resolution for the IT service provider is illustrated in the Figure. • Detection is usually provided by monitoring software running on the servers of an account, which computes metrics for the hardware and software performance at regular intervals. • The metrics are then compared to acceptable thresholds, known as monitoring situations, and any violation results in an alert being raised. If the alert persists beyond a certain delay specified in the situation, the monitor emits an event. • Events coming from an account’s entire IT environment are consolidated in an enterprise console. The console uses rule-, case- or knowledge-based engines to analyze the monitoring events and decide whether to open a service ticket in the Incident, Problem, Change (IPC) system. • Additional tickets are created upon customer requests. The information accumulated in the ticket is used by the System Administrators (SAs) for problem determination and resolution. As part of the service contracts between the customer and the service provider, the Service Level Agreement (SLA) specifies the maximum resolution times for various categories of tickets. Events Alerts Monitor CorrectiveActions Tickets Tickets Resolutions SystemAdministrator IPC System
4 Description of the problem settings and some notations used in the presentation • Performing a detailed analysis of IT system usage is time-consuming, so SAs often rely on default monitoring situations. Furthermore, IT system usage is likely to change over time. This often results in a large number of alerts and tickets, which can be categorized using the definitions provided in Table below • It is possible for a transient alert to be caused by a real system problem. • However, from the perspective of the SA, if the problem cannot be found when logging on the server, there is nothing they can do with the alert, no matter what happened before. • Some transient alerts may be indications of future real alerts and may be useful. But if those real alerts rise later on, the monitoring system will detect them even if the transient alerts were ignored. • Therefore, in our monitoring system, all transient alerts are considered non-actionable.
5 Related work • A. Network Monitoring • Network monitoring is used to check the “health” of communication by inspecting data transmission flow, sniffing data packets, analyzing bandwidth and so on. It is able to detect node failures, network intrusions, or other abnormal situations in the distributed system. The main difference between network monitoring and our proposed method is the monitored target, which can be any component or subsystem of the system, the hardware of the system (such as CPU, hard disk) or the software (such as a database engine, or a web server). • B. Actionable Event Patterns • A significant amount of work in data mining has been done to identify actionable patterns of events. Different types of patterns like (partially) periodic patterns, event bursts, mutually dependent patterns were introduced to describe system management events. Our work is based on the part of event processing workflow that takes into account human processing of the tickets. This allowed us to identify non-actionable patterns with significant precision. In the event processing workflow, non-actionable events are transformed into non-actionable tickets thus creating a number of false positives. Identification of non-actionable events made it possible to significantly reduce the number of false positives. • C. Parsing structured and unstructured data • Specialized log parsers were created to parse and transform applications and information system operation logs. Usually, logs are semi-structured, containing both structured (e.g., log entry prefixes and timestamp) and unstructured text (e.g., exception, error or warning descriptions, and display of application state). In our work, parsers are used to translate monitoring events into attribute-value pairs for further analysis. However, unlike existing works, we also include the analysis of ticket resolution descriptions for identifying real tickets where a non- trivial amount of work has been done. Such information was used to tag monitoring events as actionable or non-actionable. • D. Parameter Tuning • Parameter tuning in log patterns mining is also studied previously. Usually mining parameters describe how strongly elements of the pattern are interconnected or correlated (e.g., confidence), and what percentage of the data stream should be covered (e.g., support). The parameters considered in our work include the percentage of non-actionable events covered and the number of events covered. • Discovering time related patterns from system logs is also was considered previously. In our study, the duration time of a pattern depends on a couple of factors such as actual delay time and acceptable SLA thresholds. While the distribution of recognized non-actionable patterns depends only on historical data, we take the delay tolerance of a customer as additional input.
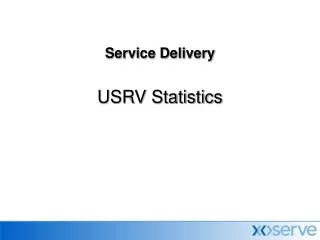
6 Constructing predictive rules for non- actionable alerts • Our solution does not predict whether an alert is real or non-actionable. • We decide whether to postpone the creation of its ticket or not, and how long is the postponement. • We analyzed historical alerts and their matching tickets from several large support accounts. • Since most non-actionable alerts are transient alerts, postponement will not affect real alerts. • Even if a real alert is incorrectly identified as non-actionable alert, its ticket will eventually be created before the violation of the Service Level Agreement(SLA). Figure above shows a flowchart of our method. • There are two key problems in this approach: • How to identify whether an alert is non-actionable or real? • If an alert is identified as non-actionable, what waiting time should be applied to it?
7 System, Method and Life Cycle • Events and alert tickets are collected in Component 1 • Both sets are preprocessed in Component 2 • In Component 3, we search for predictive rules to build the non-actionable alert predictor • The waiting time in being calculated by Component 4 • After verification the predictive rules and the waiting time are deployed to production servers in Component 5 • Component 1 is revisited to collect new events and tickets. • As the processing loop is designed for periodic (once- a-month) approach, all processes in the system are off-line. • This presentation is focused on the details of Component 3 and 4, since Components 1, 2 and 5 are straightforward.
8 Predictive Rules • The alert predictor roughly assigns a label to each alert, “non- actionable” or “real”. • It is built on a set of predictive rules that automatically generated by a rule-based learning algorithm [Mining quantitative association rules] from historical events and alert tickets . • Example 1 is an example of the predictive rule, where “PROC CPU TIME” is the CPU usage of a process. “PROC NAME” is the name of the process. • if PROC NAME = ‘Rtvscan’, then this alert is non-actionable. • A predictive rule consists of a rule condition and an alert label. • A rule condition is a conjunction of literals, where each literal is composed of an event attribute, a relational operator and a constant value. • In Example 1, two literals are: • Two literals are “PROC CPU TIME > 50%” and “PROC NAME = ‘Rtvscan’”, • where “PROC CPU TIME” and “PROC NAME” are event attributes, • “>” and “=” are relational operators, and • “50%” and “Rtvscan” are constant values. • If an alert event satisfies a rule condition, we call this alert is covered by this rule. As for the alert label, since we only need predictive rules for non-actionable alerts, the alert label in our case is always “non-actionable”. • The rule-based learning algorithm sequence: • create all literals by scanning historical events. • apply a breadth-first search for enumerating all literals in finding predictive rules
9 Predictive Rule Generation • We are interested in predictive rules which have predictive power. • What is the criteria to quantify the minimum predictive power? • the minimum confidence minconf and the minimum support minsup. • minconf is the minimum ratio between the number of non-actionable alerts and the number of all alerts covered by the rule, and • minsup is the minimum ratio between the number of alerts covered by the rule and the total number of alerts. • For example, minconf = 0.9 and minsup = 0.1, • for each predictive rule found by the algorithm, at least 90% covered historical alerts are non-actionable, and there are at least 10% historical alerts are covered by this rule. • The two criteria govern the performance of our method, defined as the total number of removed non-actionable alerts. • To achieve the best performance, we loop through the values of minconf and minsup and compute the performance for each pair
10 Predictive Rule Selection • Server Level Agreement (SLA) often prescribes how a real ticket must be handled, including acknowledgement and resolution within a certain time. • Our method has the maximum allowed time for postponing a ticket as one of its input parameters. • In addition, for each monitoring situation, our method also needs to know the maximum ratio of real tickets that can be postponed, which is mainly determined by the severity of a situation. • The maximum ratio of real alerts that can be delayed, ratiodelay, 0 ≤ ratiodelay ≤ 1. • The maximum allowed delay time for any real alert, delaymax, delaymax ≥ 0. • ratiodelay and delaymax are specified by the system administrators according to the severity of the monitoring situation and the SLA with customers. • From a large number of generated rules we select only predictive rules with strong predictive power. • We use Laplace accuracy for estimating the predictive power of a rule defined as follows: • where D is the set of alert events, • ciis a predictive rule, • N(ci) is the number of events in D satisfying rule ci, and • Nnon is the total number of non-actionable events in D. • For example, if a rule c1 in D has LaplaceAccuracy(c1, D) = 0.9, it implies that given an alert e which is covered by c1, the probability of e being non-actionable is 0.9.
11 Why choose a a rule-based predictor • First, each monitoring situation is equivalent to a quantitative association rule, so the predictor can be directly implemented in the existing system. • Other sophisticated classification algorithms, such as support vector machine and neural network, may have a higher precision in predicting non-actionable alerts. However, their classifiers are very difficult to be implemented as monitoring situations. • The second reason is that a rule-based predictor can be easily verifiable by a human actor, in this case system administrators. • For instance, Example 1 implies that high CPU utilization alerts from ‘Rtvscan’ are non-actionable. This does not create a problem for the system administrators because they can check with the server and verify that ‘Rtvscan’ is from the Norton Anti-Virus software. In contrast, a linear/non- linear equation or a neural network formed by several system attributes is very hard for a system administrator to verify. • Example 1: • “PROC CPU TIME > 50%” and “PROC NAME = ‘Rtvscan’”, • “PROC CPU TIME” is CPU utilization and • “PROC NAME” is identified running process
12 • Waiting time is the duration by which tickets should be postponed if their corresponding alerts are classified as non- actionable. • An alert can be covered by different predictive rules, we set up different waiting times for each of them. • For example, the situation described in Example 1 predicts non-actionable alerts about CPU utilization of ‘Rtvscan’. We can also find another predictive rule as follows: • if PROC CPU TIME > 50% and PROC NAME = ‘perl logqueue.pl’, then this alert is non-actionable. • However, this ‘perl’ process is different from that of ‘Rtvscan’, and their durations are not the same, and the waiting time will differ accordingly. • In order to remove as many as possible non-actionable alerts, we set the waiting time of a selected rule as the longest duration of the transient alerts covered by it. For a selected predictive rule p, its waiting time is • where • and F is the set of transient events. Clearly, for any rulep ∈ P, waitp ≤ delaymax. Therefore, no ticket can be postponed for more than delaymax. Calculating Waiting Time for Each Rule
13 Evaluation • Experimental alert events and tickets are collected during 3 month period from production servers of two large accounts. |D| is the number of events that generated tickets in the ticketing systems. Nnon is the number of non- actionable events in all ticketed events. # Situations is the number of monitoring situations. # Nodes is the number of monitored servers. • Performance Measure • FP: The number of non-actionable tickets eliminated. • FD: The number of real tickets postponed. • To achieve a better performance, a system should have a larger FP with a smaller FD. • Each data set is broken into the training and the testing subsets. • “Testing Data Ratio” is the fraction of the testing part in the data . All F P and F D are only evaluated for the testing part. • Comparing with Revalidate • Since most alert detection methods cannot guarantee no false negatives, we only compare our method with Revalidate, which revalidates the status of events and postpones all tickets. • Revalidate has only one parameter, the postponement time, which is the maximum allowed delay time delaymax. • While Revalidate is clearly better in terms of elimination of non- actionable alerts, it postpones all real tickets, the volume of postponed by Revalidate tickets is from 1000 to 10000 times larger than our method.
14 Results for Account 1
15 Results for Account 2
16 Delays (1) – Account 1, July 2011 data Disk space rules:#NonAct=633, #Real=21 [free_megabytes <= 1537, situation_name = afi_dsp_3ntc_stl_lex_std]#NonAct=459, #Real=3 [free_megabytes <= 1541, situation_name = afi_dsp_3ntw_stl_lex1_std]#NonAct=628, #Real=48 situation_name = afi_dsp_3ntw_stl_lex3_std] X-axis is timestamp
17 Delays (2) –Account 1, July 2011 data Other rules:#NonAct=502, #Real=22 [situation_name = afi_instatus_gudf_std]#NonAct=197, #Real=17 [situation_name = afi_log_xux2_DP_E2_udp002_std]#NonAct=249, #Real=23 [situation_name = afi_log_xux2_DP_E2_udp003_std]#NonAct=208, #Real=28 [system_uptime <= 1612983, number_of_users < =3, situation_name = afi_tra_rlzw_std] No duration available
18 Delays – Account 2, Jun-Jul 2011 data 100% training data, 2011-06-18 to 2011-07-30 944 non-actionable alerts289 real alerts119 servers (auto-ticketing only) Most productive rules:#NonAct.=410, #Real=3 [situation_name = ahe_cpu_xuxw_std]#NonAct=165, #Real=2 [situation_name = iga_prccpu_3ntw_std]#NonAct=126, #Real=0 [situation_name = iga_tra_xuxw_std]
19 Conclusion and future work • This work provides an automated refinement for monitoring conditions (situations) which facilitates a closed loop approach to system management. • This solution can reduce the number of non-actionable (false positive) tickets generated from monitoring alerts while retaining all actionable (or real) tickets. • A rule based learning algorithm with coverage, confidence and rule complexity criteria is involved in this solution. • Furthermore, it can be used periodically to adjust monitoring situations after a system has gone through a change, thus helping to enhance the overall reliability in IT Service management. • In our future work, we will investigate and develop more advanced and efficient rule learning algorithms for generating predictive rules for monitoring situations.
20 Back up Optimize monitoring situation definitions to minimize the number of non-actionable alerts. Create a component that can analyse account event and ticket data and automatically recommend situation optimizations. Create a repeatable process that can be run periodically on each account as part of the monitoring lifecycle.
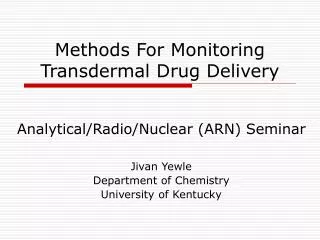
21 Paging Utilization – Threshold Tuning • Default thresholds: Avg_PageIns_15 >= 400, Avg_PageOut_15 >= 400 • For each server, find the threshold value that still detects all the true alerts but ignores as many false alerts as possible. • Before: 125 tickets, incl. 123 non-actionable alerts • After: 12 tickets, incl. 10 non-actionable alerts Avg_PageOut_15 Avg_PageIns_15 Example: 9.56.218.187