Download

1 / 57
570 likes | 822 Views
The PAHO model for estimating the impact of changes in Intellectual Property Rights. Joan Rovira, Universitat de Barcelona Ismail Abbas , Universitat Politècnica de Catalunya . Content. Justification and objectives of the project Model specification and description

E N D
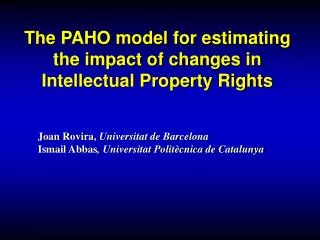
The PAHO model for estimating the impact of changes in Intellectual Property Rights Joan Rovira, Universitat de Barcelona Ismail Abbas, Universitat Politècnica de Catalunya
Content • Justification and objectives of the project • Model specification and description • Illustrative results for Colombia and Malaysia • Discussion Acknowledgement: This project has been funded by the PAHO-WHO
The changing environment of IPR regimes • Global trends and pressures towards an international upwards harmonization of IPR to developed countries’ standards • Regional agreements: Single European Market-EU, NAFTA • The TRIPS agreement • Bilateral agreements • National implementation of agreements and other policies
The impact of changes in IPR regimes might affect, with varying levels of uncertainty: • Market exclusivity - competition • Prices • Expenditure • Consumption – access – health • Foreign investment • Domestic production, employment • Imports – exports - balance of trade • R&D and innovation (global and domestic; general and on country-specific diseases) • Technology transfer
The timing of the impacts of changes in IPR provisions • Short-term • Test data exclusivity • Conditions for compulsory licensing • Date of enforcement, transitory periods • ... • Long term (we’ll all be dead, according to J M Keynes?) • Duration of patent (>20years) • Scope of patentability • ...
Information needs of decision-makers • Decision-makers, such as the negotiators of a trade agreement, must often consider and take quick decisions on proposals related to IPR, which might have a substantial impact on the future access to pharmaceuticals and, ultimately, on the health status in their countries. • Although it is increasingly apparent to most developing countries’ negotiators that stronger (TRIPS plus) patent protection is likely to have negative net effects on drug accessibility and health status, trade agreements often require trade-offs in a given sector in order to obtain advantages (e.g. tariff reductions to agricultural exports) in other sectors. • If concessions have to be considered or made in a given sector, it is important to be able to identify and quantify as precisely as possible the future impact, in order to compare it with the expected benefits from other sectors.
Objectives of the project • To develop a user-friendly tool for decision-makers that allows them to estimate the future impact of changes in IPR and related pharmaceutical policies • To collect the required information, implement and test the model in several countries (initially, Colombia, Costa Rica and Guatemala, later Malaysia, Vietnam, India, … ) • To assess the information and knowledge gaps and to propose an agenda for future research
Development of a Model to Assess the Impact of Changes in IPRVersion: 17-11-2006 Content Justification and objectives of the project. IntroductionLiterature review When to evaluate the impact Options to evaluate How to evaluate the impact Impact variables Presentation of the model of Impact of Changes in the IPR Structure and general characteristics of the model of Impact of Changes in the IPR Operation of the model Translating IPR changes into model parameters Definition and calculation of impacts Key assumptions of the model
Development of a Model to Assess the Impact of Changes in IPRVersion: 17-11-2006 Appendix 1: Model Specification Appendix 2: Data required for the application of the IPR Impact Model to a given country Appendix 3: Suggested Reporting Format for Country Analysis Appendix 4: Abbreviated User’s manual
The PAHO IPR Impact Model • A general model, not a country application • Deterministic (sensitivity analysis) • Macroeconomic (agreggated) • Computer assisted simulation model (Excel)
The model estimates the impact of alternative scenarios on pharmaceutical expenditure, consumption and market share of the domestic industry over a defined time horizon.The baseline scenario estimates the evolution of the variables under the existing IPR rules. The alternative scenarios reflect the evolution of the variables under other combinations of IPR rules that might result from TRIPS enforcement, bilateral trade agreements or autonomous IPR and pharmaceutical policies, in general. The impact of a given alternative scenario x is defined as the difference in a given outcome variable between the baseline and the alternative scenario.
Final impact variables Impact of scenario x: IMVx: Increase in expenditure/sales/market value rCx: Relative reduction in consumption (in units) RMSDx: Reduction in the sales of the domestic industry
The model first computes the number and proportion of AI under exclusivity for all years over the time horizon:The data input required includes:TAPto: Number of AI (active ingredients) on the market at the beginning of the initial yearAIi: Number of AI entering the market each year AOi: Number of AI exiting the market each year AIPPi: Number of AI entering the market with patent protection each year AIDPi: Number of AI entering the market with test data protection each year
The duration of the effective exclusivity time derived from a patent is computed as: EEP = PD – DT + PDE + TTC + DGE, where: PD is the nominal patent duration DT is the time elapsed between patent filling and registration/market authorization PDE is the extension of patent duration due to compensation for delays in patent approval, which might affect a certain proportion of AI, pPDE)TTC is the time elapsed between the patent expiration time and generic market entry (associated to Bolar provision) DGE is the delay in generic market entry due to the linkage between registration and patent, which might affect a certain proportion of AI, pDGE)
The model then computes the average price differential of medicines between the baseline and any alternative scenario by means of a price index that takes the value 1 each year of the baseline scenario:(Alternative scenarios x are indicated by the superindex (x)Pi = 1 Pxi = [1+( pexi – pei)*(RPec – 1) + (1- pexi)*(pdi- pdxi)*(RPbd – 1)]pei: Share of the relevant market under exclusivity in year iRPec: Relative weighted average price of an AI under exclusivity (APe) vs. its price under competition (APc) pdxi: share of branded products in the non-exclusive segmentRPbd: Relative weighted average price of an branded vs. unbranded (INN) AI
Reduction in consumption (quantities demanded) and expenditure increase are taken as proxis for reduction in access caused by price increases. The demand function is assumed to have a constant price-elasticity, e, and the following expression: q = k pe whereq: units demanded k: constantp: price (index)e: price-elasticity of demand; e = (dq/q)/(dp/p)The price-elasticity of demand indicates the relative change in the quantity demanded as a response to a 1% change in price.
The expenditure/sales/market value in the baseline scenario is computed as: MVi = MVi-1*(1+α)The expenditure/sales/market value in the alternative scenario x is computed as: MVix = MVxi = MVi* Pxi e+1
Impact of a change of the price on consumption and expenditure
The reduction in market sales of domestic industry under scenario x, RMSDxi iscomputed as:RMSDx i = MVDi - MVDxi = kde* pei* MVi + kdc*(1-pei)* MVi - (kde*pei* MVxi + kdc*(1-pexi)* MVxi) wherekde: market share of domestic industry in markets under exclusivitykdc: market share of domestic industry in markets under competitionMVDi: Market sales of domestic industry in year i
The main assumptions of the model are: 1. Under the alternative scenario x, the units of the products now under exclusivity, (pexi – pei), will attain a higher relative price than under competition, Rpec. 2. The market share (in monetary terms) of each AI is the same for all AI throughout their market life3. Competition in an AI market begins immediately or some years after patent protection and test data exclusivity end. 4. The average price of an AI instantaneously drops by a given fixed proportion when competition starts.
5. The model assumes that the domestic industry will maintain all the time and under any scenario the initial market share in the markets under exclusivity and under competition. As it is likely to have a higher share in the competitive market, as long as the competitive market decreases in relative terms, the share of the domestic industry in the total market will come down. The absolute value of this market share cannot be unambiguously predicted as it depends, as well, on the growth of the market.
Preliminary results for Colombia • The time horizon for the simulation is 2005-2050. • In the baseline scenario the share of the market under exclusivity rises until 2019 and remains stablethereafter at 43% • If patent duration is extended to 21 years, the market share under exclusivity levels off a year later, in 2020, at a 47%, and pharmaceutical expenditure is 5.7% higher than in the baseline scenario. • Increasing by one year the duration of the exclusivity for test data protection would imply a stabilization of the market share under exclusivity in 2019 at 44% and a 1.5% increase in expenditure over the baseline scenario. • If Colombia had not enforced product patent protection in 2000 and test data protection in 2002, it might have saved an estimated 69% of the pharmaceutical expenditure over the simulated period.
IPR Impact ModelPreliminary Results in Malaysia • Final purpose of analysis was to estimate the likely impact a stronger IPR protection on medicine prices in Malaysia if Malaysia signs the US-Malaysia FTA bilateral agreement
Preliminary results based on currently available data • The time horizon for the simulation is 2007-2047 • If all standard USFTA provisions are accepted, the worst case scenario simulated would result in increase in pharmaceutical expenditure of 46% or a reduction in consumption of 56% • If data exclusivity alone is introduced, the worst case scenario simulated would result in a reduction of consumption by 50% or an increase in expenditure of 38% • If the proportion of medicines that are patented increases, the worst case scenario simulated is a reduction in consumption of 36% or an increase in expenditure of 28%
Discussion • The model has proved easy to understand and use by decision-makers with no previous experience in simulation models • Most of the information required for running the model was available and relatively easy to collect in the pilot test countries • The model results are very sensitive to the data and assumptions on the initial number of AI, and of those entering and exiting the market. The number of existing AI should be adjusted in order to ensure that it reflects the number of AI in the market that have a market share similar to the future new entrants.
Discussion • Additional analyses are also required on the price differential of AI in competitive markets and in markets under exclusivity conditions • Although the results look plausible, it is necessary to improve the evidence base by undertaking systematic reviews and, when required, new analyses of the impacts of IPR changes. • The values of some of the parameters that define the scenarios in the model directly reflect the options of the decision maker, e.g. duration of the patent or year of enforcement of pharmaceutical patents. • For other parameters the values are less straightforward, and will require specific studies and subjective technical judgments. E.g. how will an hypothetical broader scope of patentability affect the proportion of AI that will enter the market with patent protection?
Generic Units as % of Total Unit Sold Generic Price as % of Brand Price Generic Penetration of Brand Market: Units Sales and Price per Unit 6 Months Exclusivity (Generic) Generic Price Competition (More Firms = Lower Prices) Commodity Equilibrium Price Reached (Modest Price Inflation Expected) Months after First Generic Entry into Market SOURCE: Compiled by the PRIME Institute, University of Minnesota from data found in Kidder, Peabody
Estimating the price differential exclusivity-competition • The price of original drug under exclusivity is 100 • The average price of the generics after three years of patent expiration is 25 • Market share of generics after three years is 85% and that of the original product, 15% • The final average price of the AI is: • 100 x 0,15 + 25 x 0,85 = 38,75 • The price of the AI under exclusivity is 2,5 times that of the price under competition
Estimation of relative average prices of drugs Sales of unbranded generics (UBG) / Total sales --------------------------------------------------------------------- = Units of unbranded generics (UBG) / Total units Units of UBG x average UBG price / Total units x average price = -------------------------------------------------------------------------------------------- = Units of unbranded generics (UBG) / Total units average UBG price = --------------------------- = RELATIVE PRICE OF UBG average price
Estimation of potential savings from an INN policy POTENTIAL SAVINGS (in % of total sales) = SHARE OF BRANDED GENERICS SALES x ( 1 - RELATIVE PRICE OF UBG / RELATIVE PRICE OF BG ) x 100 Assumptions: In the absence of brand names, competition would reduce the present prices of BG to the level of UBG.
Impact of generic competition on pharmaceutical prices (1) • (A substantial share of) the reduction of ARV annual treatment costs between 2000 and 2003 from US$ 10.000 to 300 should (probably) be accounted to generic competition. • A recent WHO-HAI study, The price of medicines, shows ratios between generic and branded originals in the range of 1:2 (Armenia), 1:3 (Sri Lanka), and from 1:2 up to 1:7 in Kazakhstan
Impact of generic competition on pharmaceutical prices (2) • A recent study applied WHO-HAI methodology in Malaysia • Survey was conducted from October-2004 to January 2005. • 48 drugs were surveyed by using systematic sampling technique in four geographical regions of Malaysia • Babar et al, A survey of medicine prices in Malaysia by using WHO/HAI methodology. UCSI-USM, October 2005.
Median MPRs of IB, MSG and LPG in Public for Procurement Sector, Private Sector Retail Pharmacies and Dispensing Doctors Sector
Thanks for your attention • For additional information, please contact Joan Rovira joanrovira@ub.edu
Fixed parameters • YI: Initial year of simulation period • YL: Last year of simulation period • TAPtn: Number of existing active ingredient (AI) in the market in year tn; tn <YI • AIi: Number of AI entering the market in year i; i > tn • AOi: Number of AI exiting the market in year i; i > tn • DT: Time from patent filling (or approval) of an AI to market registration (approval) of the original product • MVto: Total sales/expenditure of the relevant market in year to • α: annual rate of growth of MV • RPec: Relative weighted average price of an AI under exclusivity (APe) vs. its price under competition (APc) • d: discount rate • kde: market share of domestic industry in markets under exclusivity • kdc: market share of domestic industry in markets under competition
Scenario-dependent parameters YP: initial year of product patent enforcement pp: Percentage of patented (product patent) AI entering the market in year i PD: Patent duration in years YDP: initial year of data protection enforcement AIDPi: Number of AI entering the market in year i with test data protection DE: Duration of exclusivity due to test data protection TTC: Time from patent expiration to generic competition e: price-elasticity of demand
Impact variables Impact of scenario x: IMVxi: Increase in total sales/expenditure of the relevant market in year i. RICi: Reduction in consumption (units) in year i RMSDxi: Reduction in market sales of domestic industry in year i
ASEF ASIA-EUROPE FOUNDATION CULTURES &CIVILISATIONSDIALOGUE “8th Talks on the Hill” Re-righting Intellectual Property:Economic and Social policy challenges in Asiaand Europe Singapore, 7th-9th of May 2006 SELECTED ASEF ROUND TABLE RECOMMENDATIONS: