Download
1 / 3
30 likes | 157 Views
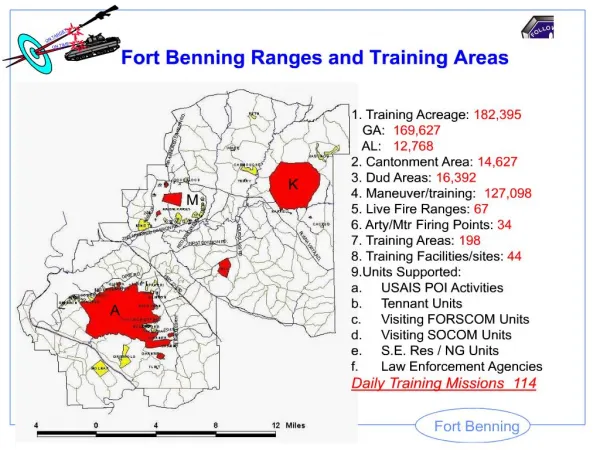
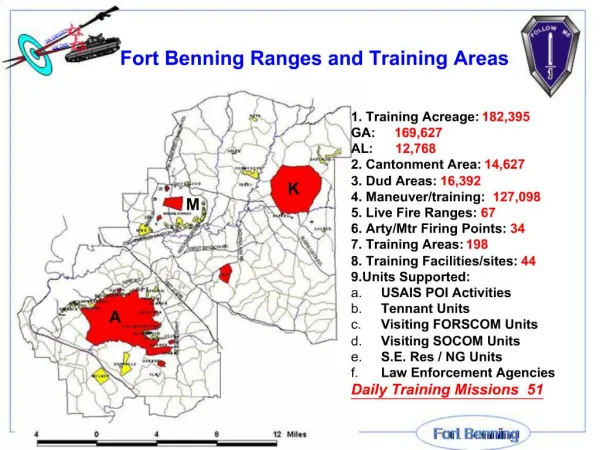
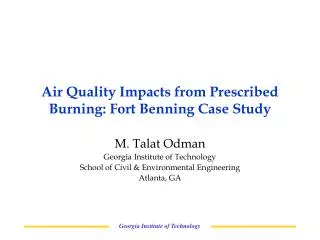
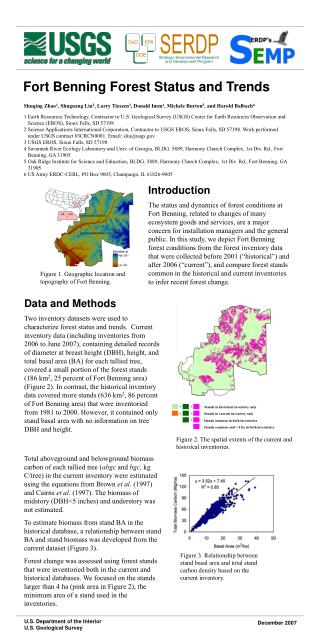
Figure 1. Geographic location and topography of Fort Benning. +. +. +. +. +. Stands in historical inventory only. Stands in current inventory only. Stands common in both inventories. Stands common and > 4 ha in both inventories. Fort Benning Forest Status and Trends.

E N D
Figure 1. Geographic location and topography of Fort Benning. + + + + + Stands in historical inventory only Stands in current inventory only Stands common in both inventories Stands common and > 4 ha in both inventories Fort Benning Forest Status and Trends Shuqing Zhao1, Shuguang Liu2,Larry Tieszen3, Donald Imm4, Michele Burton5, and Harold Balbach6 1 Earth Resources Technology, Contractor to U.S. Geological Survey (USGS) Center for Earth Resources Observation and Science (EROS), Sioux Falls, SD 57198 2 Science Applications International Corporation, Contractor to USGS EROS, Sioux Falls, SD 57198. Work performed under USGS contract 03CRCN0001. Email: sliu@usgs.gov 3 USGS EROS, Sioux Falls, SD 57198 4 Savannah River Ecology Laboratory and Univ. of Georgia, BLDG. 5889, Harmony Church Complex, 1st Div. Rd., Fort Benning, GA 31905 5 Oak Ridge Institute for Science and Education, BLDG. 5889, Harmony Church Complex, 1st Div. Rd., Fort Benning, GA 31905 6 US Army ERDC-CERL, PO Box 9005, Champaign, IL 61826-9005 Introduction The status and dynamics of forest conditions at Fort Benning, related to changes of many ecosystem goods and services, are a major concern for installation managers and the general public. In this study, we depict Fort Benning forest conditions from the forest inventory data that were collected before 2001 (“historical”) and after 2006 (“current”), and compare forest stands common in the historical and current inventories to infer recent forest change. Data and Methods Two inventory datasets were used to characterize forest status and trends. Current inventory data (including inventories from 2006 to June 2007), containing detailed records of diameter at breast height (DBH), height, and total basal area (BA) for each tallied tree, covered a small portion of the forest stands (186 km2, 25 percent of Fort Benning area) (Figure 2). In contrast, the historical inventory data covered more stands (636 km2, 86 percent of Fort Benning area) that were inventoried from 1981 to 2000. However, it contained only stand basal area with no information on tree DBH and height. Figure 2. The spatial extents of the current and historical inventories. Total aboveground and belowground biomass carbon of each tallied tree (abgc and bgc, kg C/tree) in the current inventory were estimated using the equations from Brown et al. (1997) and Cairns et al. (1997). The biomass of midstory (DBH<5 inches) and understory was not estimated. To estimate biomass from stand BA in the historical database, a relationship between stand BA and stand biomass was developed from the current dataset (Figure 3). Forest change was assessed using forest stands that were inventoried both in the current and historical databases. We focused on the stands larger than 4 ha (pink area in Figure 2), the minimum area of a stand used in the inventories. Figure 3. Relationship between stand basal area and total stand carbon density based on the current inventory.
Figure 4. Distribution of tree density of Fort Benning forests around 2006. Tree density varied from 15 to 1,347 trees/ha across all the stands around 2006 with an average of 204 trees/ha. Figure 6. Fort Benning forest biomass distribution according to the historical inventory data. The minimum and maximum biomass carbon were 5.3 and 175.5 Mg/ha, respectively, with an average of 51 Mg/ha. Figure 5. Fort Benning forest age distribution according to the historical inventory. The youngest and oldest forest stands in the database were 1 and 332 years old, respectively, with an average of 61 years old. Fort Benning Forest Status and Trends Results Forest Status A total of 42 tree species were tallied in the current inventory. Table 1 lists the species that accounted for more than 0.5 percent of the total biomass carbon. Loblolly pine (Pinus taeda) accounted for about half of the BA, biomass, and number of trees (Table 1). Longleaf pine (P. palustris) accounted for 23 percent of the total BA and biomass carbon but only about 17 percent of the total number of trees, suggesting that the individuals of longleaf pine trees were larger than others on average. Nevertheless, the current inventory did not reflect the overall conditions of forests at Fort Benning because the focus was on pine and mixed forests. Stand tree density (current), age (historical), and total biomass carbon (historical) are shown in Figures 4–6, respectively. Most forest stands were younger than 80 years old, and most stands had total biomass carbon less than 80 Mg/ha. Table 1. Basal area, biomass carbon, and number of trees by dominant species (total biomass C share >0.5 percent) at Fort Benning around 2006.
a b c Figure 7. Comparison of forest age, basal area, and biomass carbon between the current and historical inventories. One dot represents one forest stand larger than 4 ha. Figure 8. Age change (years) between the current and historical inventories. Figure 9. Total biomass carbon change (Mg/ha) between two inventory databases. Fort Benning Forest Status and Trends Recent Forest Change The two databases can be used to quantify the overall changes of forest conditions at Fort Benning (Table 2). Both biomass C and basal area decreased from the historical to current inventories, probably due to selective cutting and harvesting. Table 2. Comparison of basal area, age, and biomass carbon stocks derived from the current and historical forest inventories. It should be noted that Table 2 largely reflects changes in the pine and mixed forests because the current inventory focused on these forests. However, the existing inventory databases might not be suitable for quantifying location-specific changes of age, BA, and biomass carbon (Figures 7–9). Large uncertainties still exist in the inventory databases. For example, Figure 7 (panels b and c) and Figure 9 show that BA and biomass carbon decreased for about 70 percent of the stands from the historical to the current inventory, indicating widespread selective cutting during this period. On the other hand, carbon accumulation rates due to growth in some stands were extremely fast. Were forests at Fort Benning really as dynamic as seen in Figures 7–9? Summary The existing forest inventory system needs to be modified to ensure that the status and trends of forests at Fort Benning are continuously and spatially explicitly monitored. Future effort should be directed to resolving the inconsistency between historical inventory datasets and generating benchmark spatial data layers for various scientific studies and resource management. AcknowledgmentsThe project (SI-1642) is supported by theStrategic Environmental Research and Development Program(SERDP). We thank James Parker and other Fort Benning staff for providing the original forest inventory data. Valuable comments, suggestions, and logistic support from J. Hall, and L. Mulkey are greatly appreciated. References Brown S, Schroeder P and Birdsey R. 1997. Forest Ecology and Management 96: 37-47. Cairns MA, Brown S, Helmer EH and Baumgardner GA. 1997. Oecologia 111: 1-11.