Download
1 / 13
130 likes | 158 Views
Analysis of waveforms, noise types investigation, peak detection algorithms, peak finding criteria, anode current monitoring, muon rate reproducibility, and timing correlation. Presented at a technical meeting.

E N D
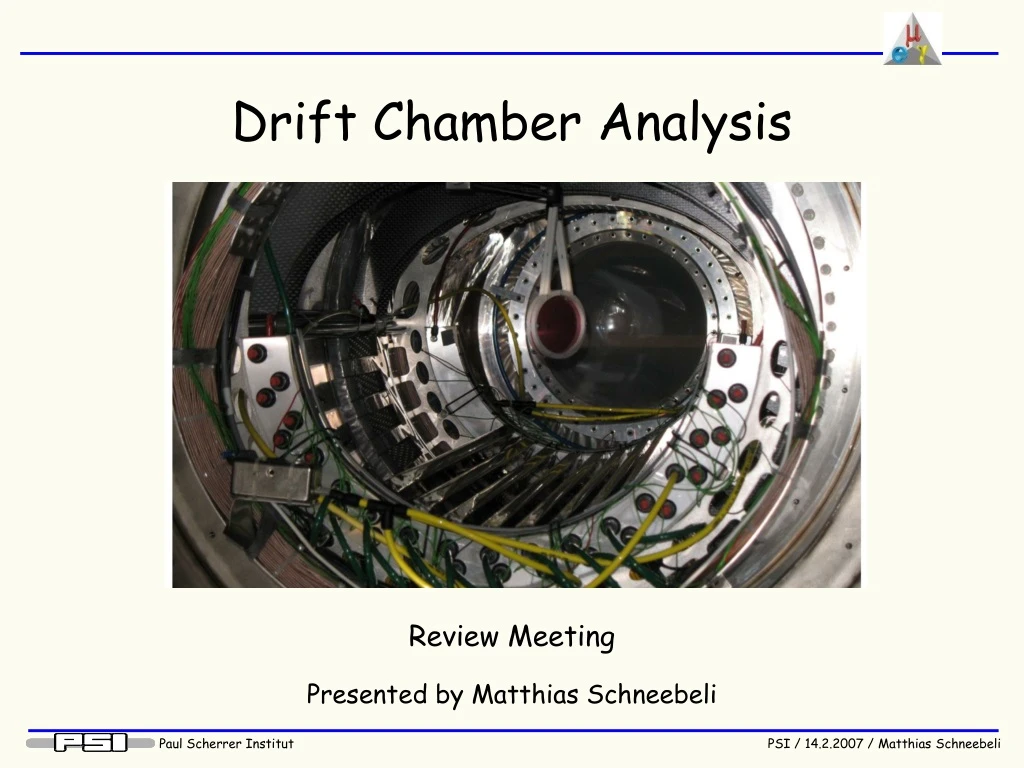
Drift Chamber Analysis Review Meeting Presented by Matthias Schneebeli
Waveforms anode (U) anode (D) vernier (0) vernier (1) vernier (2) vernier (3)
Noise • Fast oscillation : • Coming from voltage supply • Slow oscillation : • Under investigation -> Both types of noise can be reproduced in the Lab
Peak Finder I • Algorithm developed for waveforms from the trigger-board • Waveform smearing • Peak search by investigating the derivation • Baseline determination between two peaks
Peak Finder II - Baseline Baseline: Maximum in the amplitude distribution
Peak Finder II • Criteria for a peak : • Large moving average (10) > threshold • Veto : • Small moving average (4) < threshold • PeakWidth < PeakWidthMin • Pile Up : • Derivation changed from neg. to pos. Peak selection: |TAnode-U -TAnode-D | < Tmin
(nA) FS41= 135 FS41= 250 (full intensity) FS41= 100 FS41= 180 FS41= 75 FS41= 60 Beam instantaneous interruption beam closed (sec) Anode Current The anode current has been monitored during the whole beam time
Number of Peaks DATA RUN#156~#163 FS41=100 (~25% intensity) primary proton : 1.4mA DAQ pre-scale = 10 # of trigger ~ 10k MC RUNCONFIG = 1 (RUN2006) event mode = 30 (muon) # of generation = 1M -> Very rough normalization -> No efficiencies included
Data MC Number of Peaks II Similar result obtained by a completely independent analysis
Muon Rate Muon rate can be reproduced with DC data Normalized at 100% the maximum intensity
Timing -> We see a correlation with the trigger
Cathode Asymmetry FS41 = 100 FS41 = 250
Anode Asymmetry MC: Use z-coordinate Data : Use Anode asymmetry