Download
1 / 38
380 likes | 398 Views
Explore the evolving nature of terrorism risk management post-9/11 and its implications for ERM, insurance, and market stability. Gain key insights on emerging terrorism scenarios and limitations of traditional risk tools.

E N D
Terrorism & Enterprise Risk ManagementScenarios & Uncertainty • Enterprise Risk Management Symposium • Chicago, IL • April 15, 2008 Robert P. Hartwig, Ph.D., CPCU, President Insurance Information Institute 110 William Street New York, NY 10038 Tel: (212) 346-5520 Fax: (212) 732-1916 bobh@iii.org www.iii.org
Presentation Outline • Terrorism Risk • What do we know 6 ½ after 9/11? • Implications for risk managers and ERM • Terrorism Scenarios • Limited utility of traditional tools of risk management • ERM & The Holistic Approach to Managing Terrorism Risk • The Market for Terrorism Insurance
WHAT DO WE KNOW?6 ½ YEARS AFTER 9/11, IS TERRORISM AN INSURABLE RISK?
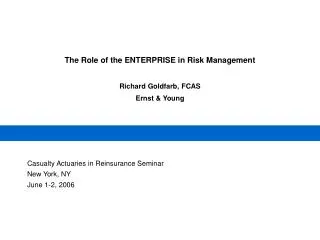
International Terrorist Incidents, 1989-2006* The number of international terrorist attacks fluctuates significantly over time Will a drop in the number of attacks breed complacency? *Approximately half of the attacks from 2004-2006 were in Iraq. Source: Lloyd’s, Under Attack: Global Business and the Threat of Political Violence, April 2007.
Our Knowledge About Terrorism is Still Remedial; Insurance Markets Limited • Absence of terrorist attacks on American soil since 2001 has helped to restore stability and confidence in the US economy and commercial insurance markets • Ironically, the absence of attacks means that what we have learned since 2001 is mostly academic, circumstantial or indirect—garnered from the experience of other countries (e.g., U.K., Spain) • Some important experience has been gained in avoiding attacks • In contrast, we’ve learned much from the hurricanes of 2004/05 • Hundreds of billions of dollars have been spent on national security (effectively tools of risk management available exclusively to government), but this has a limited practical actuarial effect on the price or availability of terrorism-exposed lines of insurance • Conclusion: Terrorism is nearly as uninsurable to day as it was in the wake of 9/11 • Stability in the market is due almost exclusively to 2 factors: • (i) TRIA (ii) Absence of subsequent attacks since 2001
Implications for Risk Managers& Enterprise Risk Management • Since 2001 risk managers have been left with three fundamentally difficult or impossible tasks regarding terrorism risk: • Identification • Quantification • Mitigation • Identification: Thousands of vulnerabilities have been identified, but many (and perhaps most) have not • Quantification: Models have been developed that help determine the dollar damage of property and casualty exposures, but how accurate are they (no doubt less so than catastrophe models)? • Mitigation: Corporations and government have spent hundreds of billions to reduce perceived risks, but most are unproven. • Enterprise Risk Management implies that a holistic approach to such risk be taken, but the practice of ERM in the terrorism context is hampered by huge knowledge gaps
Terrorism Violates Traditional Requirements for Insurability Source: Insurance Information Institute
Terrorism Violates Traditional Requirements for Insurability (cont’d) Source: Insurance Information Institute
Terrorism Scenarios:Modeling Severity & Frequency Weapons Selection • Blast/Explosion • Chemical • Biological • Radiological • Other (e.g., Dam Failure) Frequency • Weapon availability • Target attractiveness • Relative attractiveness of region Casualty Footprint • Physical distribution of intensity of event Exposure • Location • # & Type Employee State-by-State Analysis Targets • Type of structure/facility Sources: Insurance Information Institute based on NCCI Item Filing B-1383 & EQECAT modeling.
Additional Insurability Concerns • Information Problems: • Traditional Insurance assumes that emerging issue information is available and shared (Terrorism information sharing is “asymmetric” – Classified data is not shared). • Unique Role & Responsibility of Government: • Insurance is designed for policyholders’ insurable interests(Victims of terrorism are mostly surrogate targets for attacks mainly aimed at government, and the government is in a unique position to influence the likelihood of attack based upon foreign policy.) Source (this slide and next three): Terrorism, TRIA, and a Timeline to Market Turmoil? by James Macdonald of ACE USA, presentation before the Real Estate Roundtable, April 22, 2004.
TERRORISM SCENARIOSTraditional Tools of Risk Management Can Provide Only Limited Benefits/Insight
Loss Distribution by Type of Insurance from September 11 Terrorist Attack ($ Billions)(Stated in 2007 Dollars) Total Insured Losses Estimate: $36.9B *Final settlement amount on claims on the WTC complex itself of $4.55 billion as announced on May 23, 2007 by New York State and Port Authority of New York and New Jersey. Figure is adjusted to 2007 price level. Losses stated in 2001 dollars are $32.5 billion. Source: Insurance Information Institute
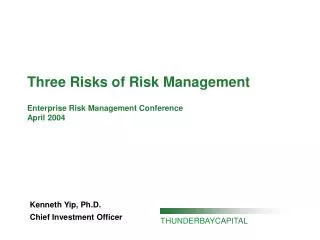
Top 5 Costliest Terrorist Attacks(by insured property loss*) $ Millions, Adjusted to 2001 Price Level Oklahoma City bombing in 1995 cost insurers $125 million 9/11/01 • 2,995 Killed • 2.250 Injured 4/24/93 • 1 Killed • 54 Injured 6/15/96 • 0 Killed • 228 Injured 2/26/93 • 6 Killed • 725 Injured 4/10/92 • 3 Killed • 91 Injured *Includes property, business interruption and aviation hull losses. Source: Swiss Re; Insurance Information Institute.
Insured Loss Estimates: Large NBCR Attack ($ Billions) Source: American Academy of Actuaries, Response to President’s Working Group, Appendix II, April 26, 2006
Models of Property and WC losses (Insured and Uninsured)* *Based on Risk Management Solutions (RMS) models. Source: RAND, Trade-Offs Among Alternative Government Interventions in the Market for Terrorism Insurance
Estimated Workers Comp Insured Losses & Deaths for Terrorist Events Fatalities 173,000 12,300 1,300 1,000 Source: Eqecat, NCCI.
Port Security War Game Estimates $58B Impact from Simulated Terrorist Attack Source: OECD report, Security in Maritime Transport: Risk Facts and Economic Impact, July 2003
Under Most Scenarios TRIA Is Dormant But Vital When Triggered* P&C U/W Loss With and Without TRIA Support U/W Loss ($ B) Total loss as % of policyholder surplus TRIA not triggered under approximately 98% of scenarios Chance of an Event *Under the Terrorism Risk Insurance Extension Act (expired 12/31/07) Source: EQECAT, NCCI
ERM & THE HOLISTIC APPROACH TO MANAGING TERRORISM RISKPreparing for the Unknown
Whose Responsible for Monitoring & Managing Terrorism and Political Risk* No consistency in the management of terrorism risk *Respondents to survey could indicate more than one response. Source: Lloyd’s, Under Attack: Global Business and the Threat of Political Violence, April 2007.
Information Sources Used by Companiesto Gather Data on Political Violence* Business rely on more instinct than insight or analysis *Respondents to survey could indicate more than one response. Source: Lloyd’s, Under Attack: Global Business and the Threat of Political Violence, April 2007.
“Traditional” Losses Arising from Terror Attack Scenarios Source: Insurance Information Institute
“Less Traditional” Losses Arising from Terror Attack Scenarios Source: Insurance Information Institute
Number of Chemical Plants that Could Threaten Nearby People How is it that the EPA DHS come to such radically different conclusions? DHS estimate is 98% less than EPA DHS estimate is 43% less than EPA Source: EPA and Department of Homeland Security from the Wall Street Journal, “Chemical Plants Still Have Few Terror Controls,” August 20, 2004, p. B1; Insurance Information Institute
Risks of Doing Business Internationally: Top 10 Country Rankings (2003-2006) Business partner risk is the risk of entering into a transaction, project or other form of relationship with a business partner. • Business Partner Score is a mean score, out of a maximum of 10, derived from three components: ventures halted or modified, transparency and integrity. • Source: Aon 2007 Political and Economic Risk Map; The Risk Advisory Group
“Non-Traditional” Losses Arising from Terror Attack Scenarios Source: Insurance Information Institute
Risk Management Reactions toPolitical Violence and Terrorism* Business globally have implemented a wide variety of responses to terrorism and political violence *Respondents to survey could indicate more than one response. Source: Lloyd’s, Under Attack: Global Business and the Threat of Political Violence, April 2007.
THE MARKET FORTERRORISM INSURANCETRIA Remains aRunaway Success
Insurance Industry Retention Under TRIA ($ Billions) • Individual company retentions fixed at 20% for 2007-2014 • Above the retention, federal govt. pays 85% for 2007-2014 Source: Insurance Information Institute
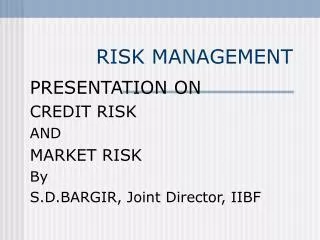
Terrorism Coverage Take-Up Rate Rising Terrorism take-up rate for non-WC risk rose through 2006 and continues to rise. TAKE UP RATE FOR WC COMP TERROR COVERAGE IS 100%!! Take-up rate exceeds 60% in Midwest, Northeast Source: 2006 Marsh Marketwatch Report; Insurance Information Institute
Terrorism Coverage: Take-Up Rates by Region Terrorism take-up rates are highest in the Northeast and Midwest Source: 2006 Marsh Marketwatch Report; Insurance Information Institute
Terrorism Coverage: Take-Up Rates by Industry, 2006 Take-up rates are much higher than just a few years ago Source: 2006 Marsh Marketwatch Report; Insurance Information Institute
Terrorism Coverage Take-Up Ratesby Total Insured Value (TIV)* $ Millions Some 60% of firms with TIV between $500 million and $1 billion buy terror coverage *Does not include firms that buy coverage through package policies. Source: 2006 Marsh Marketwatch Report.; Insurance Information Institute
Terrorism Premium as a Percentage of Property Premium by TIV* 2006 saw modest reductions for all companies, except those with TIV between $100 million and $500 million. RANGE Highest = Financial Institutions = 8.0% Lowest = Construction = 2.7% Source: 2006 Marsh Marketwatch Report; Insurance Information Institute *TIV = Total Insured Value
Terrorism Premium as Percentageof Property Premium, by Industry Source: Marsh, Inc.
Terrorism Premium as Percentageof Property Premium, By Industry Terrorism premiums have generally fallen relative to general property insurance costs Source: Marsh, Inc.
Terrorism Pricing: Median Ratesby Region (per $1 Million TIV) Terrorism insurance continues to be most expensive in the Northeast based on premium rate, though the variation by region has narrowed. Source: Marsh, Inc. 2006 Market Conditions and Analysis; Insurance Information Institute
Insurance Information Institute On-Line WWW.III.ORG If you would like a copy of this presentation, please give me your business card with e-mail address