Download
1 / 16
160 likes | 305 Views
Ranking Outliers Using Symmetric Neighborhood Relationship. Wen Jin, Anthony K.H. Tung, Jiawei Han, and Wei Wang Advances in Knowledge Discovery and Data Mining , 2006. Introduction. Outlier: Object that deviates from the rest of dataset.

E N D
Ranking Outliers Using Symmetric Neighborhood Relationship Wen Jin, Anthony K.H. Tung, Jiawei Han, and Wei Wang Advances in Knowledge Discovery and Data Mining , 2006
Introduction • Outlier: Object that deviates from the rest of dataset. • Its outlieress typically appears to be more outstanding with respect to its local neighborhood. • Applications: Fraud detection, intrusion discovery, video surveillance, pharmaceutical test and weather prediction. • Local outliers: the outliers • that have density distribution significantly different from their local neighborhood. • That have significantly lower density than its local neighborhood. • Outlierness • The degree of outlierness of an object p is defined to be the ratio of its density and the average density of its neighboring objects.
Example (1) • The densities of the nearest neighboring objects for both p and q are the same, but q is slightly closer to cluster C1 than q. In this case, p will have a stronger outlierness measure than q, which is obviously wrong. • Although the density of r is lower than p, the average density of its neighboring objects (consisting of 2 objects from C2 and an outlier) is less than those of p. Thus, when the proposed measure is computed, p could turn out to have a stronger outlierness measure than r, which again is wrong.
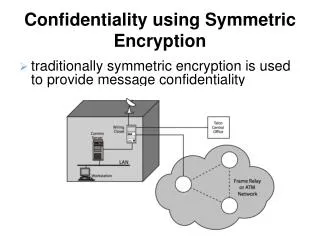
Motivation • Existing outlierness measure is not easily applicable to complex situation in which the dataset contains multiple clusters with very different density distribution. • Propose to take both the nearest neighbors(NNs) and reverse nearest neighbors(RNNs) into account when taking an estimation of the neighborhood’s density distribution. • RNNs: The RNNs of an object p are essentially objects that have p as one of their k nearest neighbors. • By considering the symmetric neighborhood relationship of both NN and RNN, the space of an object influenced by other objects is well determined, the densities of its neighborhood will be reasonably estimated, and thus the outliers found will be more meaningful.
Example (2) • p has two RNNs {s, t}. • q has no RNNS {} • r has only 1
Method proposed • Propose the mining of outliers based on a symmetric neighborhood relationship. • Assign each object the degree of being INFLuenced Outierness(INFLO). The higher INFLO is, the more likely that this object is an outlier. • Present several efficient algorithms to mining top-n outliers based on INFLO. • A Naïve Index-based method • A Two-way search method
Influential Measure of Outlierness by Symmetric Relationship • Let D be a database of size N, let p, q and o be some objects in D, and let k be a positive integer. Use d(p,q) to denote the Euclidean distance between objects p and q.
Example(3) • D = {p, q1, q2, q3, q4, q5}, k = 3 • NNk{p} = {q1, q2, q4} = RNNk{p} = {q1, q2, q4}, IS3(p) = {q1, q, q4} • NNk{q1} = {p, q2, q4}, RNNk{q1} = {} • NNk{q2} = {p, q1, q3}, RNNk{q1} = {} • NNk{q3} = {q1, q2, q5}, RNNk{q1} = {} • NNk{q4} = {p, q1, q2, q5}, RNNk{q1} = {} • NNk{q5} = {q1, q2, q3}, RNNk{q1} = {}
A Naïve Index-based Method • Finding influence outlier requires the operations of KNN and RNN for each object in the database, so the search cost is high. • Maintain all the points in a spatial index like R-tree, reduce the cost of range queries by the pruning techniques. • Suppose that we have computed the temporary kdist(p) by checking a subset of the objects, the value that we have is clearly an upper bound for the actual kdist(p) . • If the minimum distance between p and the MBR of a node in the R-tree is greater than the kdist(p), none of the objects in the subtree rooted under the node will be among the k-nearest neighbors of p. • Along with the search of KNN, the RNN of each object can be dynamically maintained in R-tree.
Algorithm1 Index-Based Method • Input: k, D, n, the root of R-tree • Output: Top-n INFIO of D. • Method: • FOR each object pЄ D DO MBRList = root; Kdist(p) = ∞; heap = 0; WHILE(MBRList) != empty DO • Delete 1st MBR from MBRList;; • If(1stMBR is a leaf) THEN FOR each object q in 1stMBR DO IF(d(p, q)< Kdist(p)) AND (heap.size<k) THEN { heap.insert(q); Kdist(p)=d(p, heap.top)} • ELSE • Append MBR’s children to MBRList; • Sort nodeList by MinDist; • FOR each MBR in MBRList DO • IF(Kdist(p) < = MinDist(p, MBR)) THEN Remove node form MBRList; FOR each object q in heap DO Add q into NNk(p), add p into RNNk(q); FOR each object pЄ D DO Ascending sort top-n INFLO from kNN and RNN;
Two-way search method • Two major factors hamper the efficiency of the previous algorithm. • For any object p, RNN space cannot be determined unless all the other objects have finished nearest neighbor search. • Second, large amount of extra storage is required on R-tree, where each objects at least stores k pointers of its KNN, and stores m points for its RNN. • Reduce the computation cost for RNN and corressponding storage cost. • By analyzing the characteristics of INFLO • Any object as a member of a cluster : INFLO ~ 1 • Prune off these cluster objects, saving not only the computation cost but also the extra storage space. Early Pruning First search p’s k-nearest neighbor, dynamically find the NNk, for each of these nearest neighbors. If NNk(NNk(p)) still contains p, which shows p is in a closely influenced space and is a core object of a cluster. We can prune p immediately.
Two-way search method • Input: k, D, n, the root of R-tree, a threshold M • Output: Top-n INFIO of D. • Method: • FOReach object pЄ D DO count = |RNNk(p)|; IF unvisited(p) THEN S = getKNN(p); // search k-nearest neighbors unvisited(p) = FALSE; ELSE S = KNN(p); // get nearest neighbors directly FOR each object qЄ S DO IF unvisited(q) THEN T= getKNN(q); unvisited(q) = FALSE; IF pЄ T THEN Add q into RNNk(p); Add p into RNNk(q); count++; IF count >=|S|*M THEN //M is a threshold Label p pruned mark; FOR each object p pЄ D’ DO //D’ is unpruned database Ascending sort top-n INFLO from KNN and RNN
Experiment • Experiment on the datasets with different sizes and dimensions. • Compare it with the LOF method • Lof ONLY considers nearest neighborhood as a density estimation space. • DataSet • Synthetic Data • Generated based on multiple-gaussian distribution • The cardinality varies from 1,000 to 1,000,000 tuples and the dimensionality varies from 2 to 18. • Real Life Data • Statistics archive of 2000-2002 National Hockey League (NHL) • Totally 22,180 records with 12 dimensions.
Synthetic Data 50 percentage of the top 6 outliers are the same points by both measures. INFLO will find even more different top outliers from LOF. outliers found by INFLO is more meaningful. LOF only considers nearest neighborhood as a density estimation space
Real Life Dataset • NHL 2000-2002 playoff data (22180 tuples) • Vary k from 10 to 50. • Projection is done on dataset by randomly selecting dimensions, and the outlierness of hockey players is evaluated. • Focus on the statistics data in 3-dimensional subspace of Games played, Goals and Shooting percentage. Rob Blake ranks 4th in INFLO but is only rank 31th outlier using LOF. • The variation of shooting percentage is usually small, since only a very few of players can become excellent shooter. Although Blake’s shooting percentage is rather low, Blake is still not too far away from other players . • Thus, based on LOF measure, Blake’s could not be ranked in the top palyers. • By INFLO, the reason for him being a most exceptional player is that there is no such type of player whose shooting percentage is so low while having so many Goals.
Conclusion • Propose the mining of outliers based on a symmetric neighborhood relationship. • The proposed method considers the influenced space considering both neighbors and the reverse neighbors of an object when estimating its neighborhood density distribution. • Propose a new measure INFLO which is based on a symmetric neighborhood relationship. • Index-based method • Two-way method • Experiments shows that the proposed methods are efficient and effective on both synthetic and real life datasets.