Download
1 / 15
150 likes | 288 Views
Body-mass index and cause-specific mortality in 900 000 adults: collaborative analyses of 57 prospective studies. Prospective Studies Collaboration Lancet 2009; 373: 1083-96. Blood pressure, cholesterol and BMI. Blood pressure. Cholesterol. 160. 5. M. Non-HDL-C. Systolic. M.

E N D
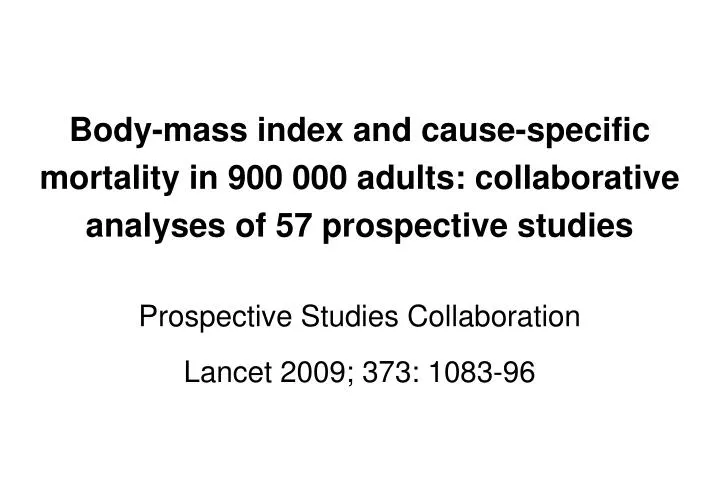
Body-mass index and cause-specific mortality in 900 000 adults: collaborative analyses of 57 prospective studies Prospective Studies Collaboration Lancet 2009; 373: 1083-96
Blood pressure, cholesterol and BMI Blood pressure Cholesterol 160 5 M Non-HDL-C Systolic M Ratio of means (non-HDL-C/HDL-C) 140 4 F F M 120 3 F mmol/L (or ratio) mm Hg 100 2 F M Diastolic HDL-C 80 F 1 M 0 15 25 35 50 15 25 35 50 Baseline BMI (kg/m2) Adjusted for age, smoking and study Fig 1a & b, Lancet 2009; 373: 1083-96
Ratio non-HDL:HDL cholesterol and BMI 5 M Mean of ratios 4 Ratio of means 3 F Ratio (Mean of ratios ~10% higher than ratio of means) 2 1 0 15 25 35 50 Baseline BMI (kg/m2) Adjusted for age, smoking and study Fig 1b variant, Lancet 2009; 373: 1083-96
Drinking, smoking, diabetes and BMI Female Male 100 100 80 80 Drinking 60 60 Prevalence% 40 40 Drinking Smoking 20 20 Smoking Diabetes Diabetes 0 0 15 25 35 50 15 25 35 50 Baseline BMI (kg/m2) Adjusted for age, smoking and study Fig 1c & d, Lancet 2009; 373: 1083-96
All-cause mortality and BMI 64 Male 32 Annual deaths per 1000 Female 16 & 95% CI (floated so matches PSC rate at ages 35-79) 8 4 15 20 25 30 35 40 50 Baseline BMI (kg/m2) Adjusted for age, smoking and study; 1st 5 years of follow-up excluded Fig 2, Lancet 2009; 373: 1083-96
IHD and stroke mortality and BMI IHD 8 4 Annual deaths per 1000 Stroke 2 & 95% CI (floated so matches PSC rate at ages 35-79) 1 0·5 15 20 25 30 35 40 50 Baseline BMI (kg/m2) Adjusted for age, sex, smoking and study; 1st 5 years of follow-up excluded Fig 3, Lancet 2009; 373: 1083-96
Main mortality categories and BMI Male Female 14 14 Vascular 12 12 Annual deaths per 1000 10 10 8 8 6 6 Vascular & 95% CI (floated so matches EU rate at ages 35-79) Cancer (other specified) 4 4 Cancer (other specified) Cancer (lung, mouth, pharynx, larynx, oes.) 2 2 Cancer (lung, mouth, pharynx, larynx, oes.) Resp. Respiratory 0 0 15 20 25 30 35 50 15 20 25 30 35 50 Baseline BMI (kg/m2) Adjusted for age, smoking and study; 1st 5 years of follow-up excluded Fig 5, Lancet 2009; 373: 1083-96
All-cause mortality and BMI, by smoking 30 Current cigarette smoker 25 Annual deaths per 1000 20 Never smoked regularly 15 & 95% CI (floated so matches EU rate at ages 35-79) 10 (N.B. The vertical separation of the curves underestimates effects of lifelong cigarette smoking) 5 0 15 20 25 30 35 50 Baseline BMI (kg/m2) Adjusted for age, sex and study; 1st 5 years of follow-up excluded Fig 6, Lancet 2009; 373: 1083-96
Lifespan and BMI in western Europe, year 2000 Male Female 100 100 88% 80 80 77% 84% 69% % alive 60 60 Yearly dots 40 40 BMI range, kg/m2 22.5-25 (mean 24) 20 20 25-30 (mean 27) 30-35 (mean 32) 0 0 40 50 60 70 80 90 100 40 50 60 70 80 90 100 Age (years) Causal PSC relative risks applied to EU mortality rates Fig 7 variant, Lancet 2009; 373: 1083-96
Lifespan and BMI in western Europe, year 2000 Male Female 100 100 88% 77% 80 80 72% 60 60 % alive Yearly dots 49% BMI range, kg/m2 40 40 22.5-25 (mean 24) 25-30 30-35 (mean 32) 20 20 35-40 40-50 (mean 43) 0 0 40 50 60 70 80 90 100 40 50 60 70 80 90 100 Age (years) Causal PSC relative risks applied to EU mortality rates Fig 7, Lancet 2009; 373: 1083-96
Comparison with smoking in the British Doctors’ Study From figure 3 in Doll, Peto et al., BMJ 2004: 328: 1519-33
All-cause mortality and BMI by smoking Male (35-69 years) Female (35-69 years) 20 20 Current cigarette smoker 15 15 Annual deaths per 1000 Never smoked regularly Current cigarette smoker 10 10 & 95% CI (floated so matches EU rate at ages 35-69) Never smoked regularly 5 5 0 0 15 20 25 30 35 50 15 20 25 30 35 50 Baseline BMI (kg/m2) Adjusted for age and study; 1st 5 years of follow-up excluded Webfig 7a & b, Lancet 2009; 373: 1083-96
All-cause mortality and BMI by smoking Male (70-79 years) Female (70-79 years) 100 100 Current cigarette smoker 75 75 Annual deaths per 1000 Never smoked regularly Current cigarette smoker 50 50 & 95% CI (floated so matches EU rate at ages 70-79) Never smoked regularly 25 25 0 0 15 20 25 30 35 50 15 20 25 30 35 50 Baseline BMI (kg/m2) Adjusted for age and study; 1st 5 years of follow-up excluded Webfig 7c & d, Lancet 2009; 373: 1083-96
Vascular mortality and BMI by smoking Male (35-69 years) Female (35-69 years) 6 6 Current cigarette smoker Annual deaths per 1000 4 4 Never smoked regularly Current cigarette smoker & 95% CI (floated so matches EU rate at ages 35-69) 2 2 Never smoked regularly 0 0 15 20 25 30 35 50 15 20 25 30 35 50 Baseline BMI (kg/m2) Adjusted for age and study; 1st 5 years of follow-up excluded Webfig 8a & b, Lancet 2009; 373: 1083-96
Vascular mortality and BMI by smoking Male (70-79 years) Female (70-79 years) 30 30 Current cigarette smoker Annual deaths per 1000 Never smoked regularly 20 20 Current cigarette smoker & 95% CI (floated so matches EU rate at ages 35-79) Never smoked regularly 10 10 0 0 15 20 25 30 35 50 15 20 25 30 35 50 Baseline BMI (kg/m2) Adjusted for age and study; 1st 5 years of follow-up excluded Webfig 8c & d, Lancet 2009; 373: 1083-96