Download
1 / 10
100 likes | 127 Views
Explore the potential long-term effects of the massive oil spill in the Gulf of Mexico. Learn about the environmental impact, threats to wildlife and industries, and various solutions being implemented.

E N D
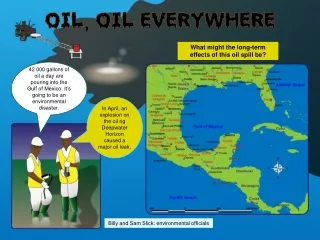
What might the long-term effects of this oil spill be? 42 000 gallons of oil a day are pouring into the Gulf of Mexico. It’s going to be an environmental disaster. In April, an explosion on the oil rig Deepwater Horizon caused a major oil leak. Billy and Sam Slick: environmental officials
On the Wildlife? On the people? This massive oil spill threatens the survival of our shrimping and oyster industries.
Have any of these helped? Massive funnel Officials are warning that sealing the leaks could take months. Burning the oil off the sea Inflatable barriers Top kill Robots Hair?? Junk shot Pumping mud, golf balls, rope and then cement into the well.
It’s in the News! Oil, oil everywhere – Teacher’s Guide On 22 April 2010 there was an explosion on the oil rig Deepwater Horizon off the coast of Louisiana in the Gulf of Mexico, which led to the greatest oil spill disaster the US and perhaps the world has ever known. 11 people died, 17 others were injured, the rig sank, and since then an enormous amount of oil has been gushing into the sea at an estimated rate of 42 000 gallons a day. Before you work on these slides you may wish to familiarise yourself with the story using information on the CBBC Newsround and BBC News (Americas) sites. These slides give opportunities for work on mathematical concepts including data handling, area, measures and number. As this has been an on-going problem for a while, it would be helpful if you could find the most up to date information to discuss with your class.
1st spread: Oil, oil everywhere ● Focus on the map of the Gulf of Mexico. Ask the children to identify the countries and the American States that are on the coast of the Gulf. You could explore these further by asking the children to make up a fact file about one each of the states or the countries. Information could include average temperature and rainfall, size of the population, currency linking in to currency conversion with the British pound, distance across the country, height of highest mountain, length of any rivers there may be. ● Use the compass on the map and ask the children directions from one place to another e.g. from San Fernando to Orlando, from Baton Rouge to Belize via Cuba. ● You could also ask them to estimate approximate distances from place to place using the scale on the map and to convert to kilometres using the approximate equivalence of 1 mile being about 1.6km. ● Ask them to find Louisiana and tell them that Deepwater Horizon was about 50 miles from the coast. Ask them to estimate its position. Can they convert that distance to kilometres using a mental calculation method? Use the scale on the map to give a more accurate measure of its position. ● They could sketch the map, labelling the different countries and states and then draw where they think the oil rig might be. If they did this on squared paper they could add coordinates and then locate various places using them. ● Tell them that the rig was about 40 miles southeast of the mouth of the Mississippi River. Ask them to identify the river and then ask them if they can position the rig more accurately on their map using the compass. ● Focus on the Mississippi River. If possible find a map with all of it featured and ask them to sketch to a suitable scale on plain paper. It is about 2 340 miles long and the second longest river in the USA. They could do some research about it. It is considered to be one of the worst-affected parts of the Gulf. …continued on the next slide
1st spread: Oil, oil everywhere continued… ● After the explosion, the oil rig burned for 36 hours. How many days, minutes, seconds is that? ● The crew numbered 126: 11 of them died and 17 were injured, can they express this as a ratio and a proportion? ● For the first few days it was estimated that 42 000 gallons of oil was coming out from the ground each day. What is that in litres? They could use the approximate rounded equivalence of 1 gallon to 4.5 litres. Ask them to fill one or two litre bottles with water and then to imagine the number they would need to make the estimated amount of oil. How many Olympic sized swimming pools would it fill, if one holds 648 000 gallons? How many baths if an average sized bath holds between 10 to 12 gallons? ● You could ask them to work out how much would be pouring out at that rate over four days, two weeks, one minute etc. ● More recent estimates say the figure above was far too low and that actually it is more likely to be one million gallons of oil a day, or between 60 to 110 thousand barrels. From this you could ask them to work out how much a barrel might hold. ● You could ask them to research the estimated amounts now and compare with the others – what is the difference? How wrong were they originally - as a percentage?. ● On 3 May it was estimated that the oil spill covered a surface area of at least 2 500 square miles. Can they work out how much that is in kilometres? (6 500 km2) Give them the information that the surface area of the Gulf of Mexico is just over ½ million square miles (579 153 sq miles or 1.5 million sq kilometres). You could link this to fractions by scaling up the oil spill size to make ½ million, so the oil slick covers roughly 1/20 of the Gulf. You could ask them to draw this on a 10x10 grid on squared paper and shade the amount roughly covered in oil. How many ways can they shade 1/20? …continued on the next slide
1st spread: Oil, oil everywhere continued… ● You could give them a copy of the map and ask them to estimate that fraction and shade where they think the oil spill may be. ● You could also use this as an opportunity to explore percentages. What percentage of the Gulf was covered with oil on the 3 May? ● Again, ask them to research the area currently covered with oil, work out how much this will be and adjust their grid accordingly. ● Discuss why this is such a disaster, what long term effects it might have and link in to the second slide.
2nd spread: What are the effects of this disaster? ● Ask the children to identify the animals on the slide. You could ask them to make up a fact file about one of them. The facts could include life span, size, weight, number of young born to one female, food eaten, habitat, how many there are in the area, and any other mathematical facts they can find. ● Younger children could sort the animals into groups such as sea creatures and birds. Do all the creatures depend on the sea? What do they need from the sea? ● One of the photos is of the oyster catcher that lives on the marshlands and beaches of the coast of Louisiana. Another is a heron which builds its nest in the same area. Take a survey of the number of children who have seen a heron and make a Carroll diagram with the criteria seen one/not seen one. ● The turtle comes to this area to lay eggs. Turtles lay between 50 to 100 eggs a year depending on the species. They could use these figures to find the average. You could use this as an opportunity to discuss average and work on finding the averages of other turtle or wild life facts such as life span. ● You could make turtle eggs from plasticine and use them to practice counting and number pair skills. ● Show the children pictures of different creatures and ask them to sort them into those that lay eggs and those that don’t. They could do this into a ready-made Venn or Carroll diagram. ● The wetlands in the area are home to lots of wildlife, including the pelican. If the oil spill reaches the shore, experts are worried that the animals won't have anywhere else to go. You could ask the children to research where else in the world pelicans can be found and make a table to show this. …continued on the next slide
2nd spread: What are the effects of this disaster? continued… ● Dolphins and sperm whales have been spotted in the area where the oil leak is. Discuss what might happen to these creatures as a result - for example they could die because the oil has a dreadful smell which causes nausea and also makes it very difficult to breathe. ● You could discuss the effect of oil and water with a practical demonstration. What would be the effect of this to the fish and other creatures in the sea? What about wildlife on the coast? ● Discuss the implications of this oil spill on the livelihood of the local people, for example fishermen and the tourist industry. You could make up some problems involving the weight of shrimps that are caught on an average shrimping day. If the fishermen charge, for example, $8 per kilo, how much will they lose in a day, a week etc. What is that in English money? ● Focus on the tourist industry and make up some related problems, e.g. a room in a hotel on the coast of Louisiana costs $80 per person per night. Convert this to pounds according to current exchange rates and work out how much the hotel will lose if 25 rooms remain empty because people don’t visit. Encourage strategies like finding the cost of ten, doubling for twenty, halving for five and finding the total. You could add onto this the costs to the shops - for example, if tourists spend an average of $15 a day on food and the restaurants lose around $450 a day, how many customers won’t be visiting? They could also convert these amounts to pounds in order to get an understanding of the ‘real’ cost.
3rd spread: What are they doing about it? ● You could play this video clip from the BBC which explains how the enormous funnel is designed to work to stop the leak. ● Ask the children to look at the diagram and find out how deep the oil leak is. What is this in metres, kilometres, miles? ● Can they explain from the diagram what the funnel will do? ● You could ask the children to draw scale diagrams or make scale models of the funnel. ● Discuss the other methods mentioned, how they were supposed to work and whether they helped or not. ● You could look at this article from the Daily Mail about the cost, at over £1 billion to clean up the mess left from the oil spill and the subsequent fall of the price of shares on the stock market. Apparently on 29 May shares had fallen by just under 26p to 495p over a five-day period. You could ask the children to work out what that was a day and then to find out how much they would be worth, if falling at the same rate, in another five days, two weeks etc. ● Younger children could explore containing spills in a water tray. Pour small items that float, such as polystyrene balls, into one end of the water tray. Ask the children to try and keep the balls or items in one part of the tray only. Encourage them to consider what might help and to try it out. Measure success by counting the number of balls contained and the number that ‘escape’. Which number is bigger? ● Older children could try to contain cooking oil within a section of a small tray and consider how to remove the oil. Begin with one teaspoon of oil and increase by one teaspoonful at a time. Compare containment methods by how many teaspoons of oil they can successfully contain. Remember to dispose of the oil sensibly.