Download
1 / 24
250 likes | 276 Views
Detailed process for vegetation mapping, data requirements, mapping steps, and QA/QC procedures for accurate results. Utilizes various data layers and field data for precise classification.

E N D
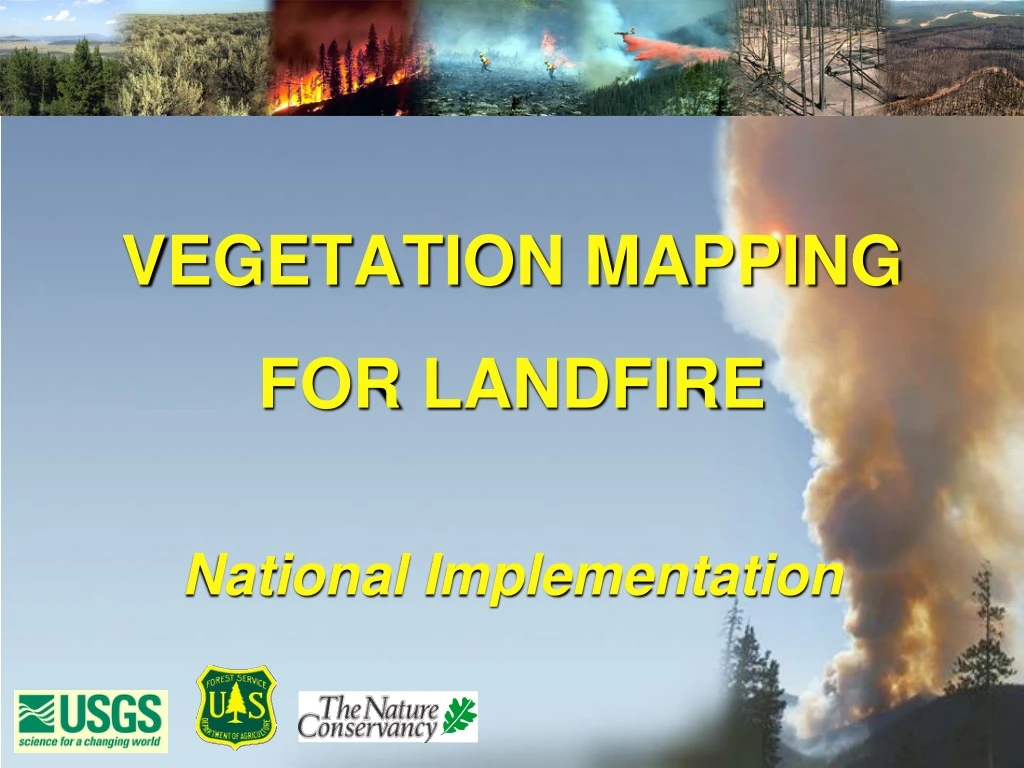
VEGETATION MAPPING FOR LANDFIRE National Implementation
Vegetation Dataset Deliverables • Existing vegetation type data layers • % Canopy Cover (separate for tree, shrub, and herbaceous data layers; binned) • Vegetation height (separate for tree, shrub, and herbaceous data layers; binned)
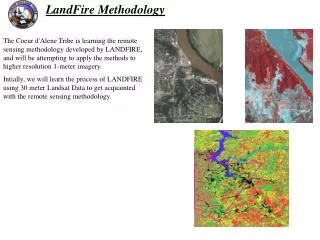
LANDFIRE Vegetation Mapping Data Requirements at EDC • LANDSAT ETM+ data (mosaics of three image dates; from MRLC) • Digital elevation model data (and derivatives; from 30m Elevation Derivatives for National Applications (EDNA)) • Preliminary classification products (from MRLC/NLCD) • Percent forest canopy cover data (from MRLC/NLCD) • High-quality field data (Map Attribute Table plot data from FIA, SCA, GAP, others) • Biophysical gradients (select list) and Biophysical settings data Major Requirements
Step 1. QA/QC of Field Data by Mappers • Isolate 2% of sample plots for traditional accuracy assessment using 3x3 k, 2% block design (do not use for map generation) • Identification of questionable plots • Identify 1990’s-2000’s NDVI difference values likely to represent plots of change • Identify plots very close to roads • Identify plots that do not match NLCD life forms • Visually assess questionable plots on imagery • If still questionable, flag plots in data base and do not use for map development
Zone 16 Plot QA/QC Results • Started with 7293 plots • 956 had no EVT information • 135 plots withheld for accuracy assessment • 6202 plots used for life form modeling • 1474 plots excluded for vegetation type mapping (about 400-500 from EROS analysis) • 4728 plots used for vegetation type mapping (65% points used for analysis)
Step 2. Vegetation Type Mapping; Part 1 • Extract digital values from spatial data layers using field plots that passed QA/QC inspection process • Generate life-form data mask (tree, shrub, herbaceous) using decision tree (Life-form field included in LFRDB) • Inspect cross-validation values/error matrices of mask • Develop additional data layers as needed (e.g., wetlands, other vegetation groupings)
Step 2. Vegetation Type Mapping; Part 2 • Run decision tree models separately for forest, shrub, and herbaceous life forms using all appropriate data (imagery, DEM and derivatives, BpG, BpS, wetlands) • Generate and inspect life-form specific cross-validation error matrices as well as spatial outputs (QA) • Assess impact of rare classes (decide to drop or keep) • Apply water, urban, agriculture masks (from NLCD) to vegetation type data layers • Merge life-form specific cover types into a single vegetation type data layer
Soil Depth Degree Days Daily Precipitation Relative Humidity Shortwave Radiation Flux Density Maximum Temperature Minimum Temperature Nighttime Average Temp Incoming Shortwave Radiation Maximum Projected LAI – Forest and Grass Models Potential Evapotranspiration – Forest and Grass Models Soil Water Fraction – Forest and Grass Models Growing Season Water Stress – Forest and Grass Models Actual Evapotranspiration – Forest and Grass Models Soil Water Potential – Grass Model Biophysical Gradient Data Used for Vegetation Type Mapping
Comparison Between Imagery and Lifeform Mask Lifeform Mask Created Using Imagery and DEM Summer ETM+ Image Mosaic
LANDFIRE Forest Class Cross-Validation Error Matrix Classified As 01 11 12 16 19 20 49 50 51 52 54 55 56 61 115 117 159 208 224 01 11 12 16 19 20 49 50 51 52 54 55 56 61 115 117 159 208 224 Reference Data
Key Cross Validation Numbers; Utah Highlands • 3-Lifeform Classification: 92% • 6-Lifeform Classification: 89% • Forest Classes: 78% • Shrub Classes: 78% • Herbaceous Classes: 65%
Step 3a. Canopy Cover; Trees • Create training set of forest canopy cover using high res orthophoto or satellite imagery (NLCD) • Establish relationship between Landsat and training data using regression tree • Apply relationship to generate spatial per-pixel estimates for all pixels • Evaluate error (R) values • Recode tree canopy continuous cover data to cover classes as defined by the Vegetation Working Group • Ensure consistency with EVT; correct when needed • Apply land cover masks: water, urban, agriculture
Utah Highlands Binned Forest Canopy Corr. Coef. = 88% (From NLCD) Avg. Error = 9.0%
Step 3b. Canopy Cover; Shrubs/Herbaceous • Extract digital values from spatial layers using field plots that have shrub or herbaceous canopy values • Stratify to life form • Generate life-form specific error values (R) • If R is acceptable, apply regression tree model • Recode shrub/herbaceous canopy continuous cover data to cover classes as defined by the Vegetation Working Group • Ensure consistency with EVT; correct when needed • Apply land cover masks: water, urban, agriculture
Utah Highlands Binned Shrub Canopy Corr. Coef. = 70% Avg. Error = 11%
Utah Highlands Binned Herbaceous Canopy Corr. Coef. = 62% Avg. Error = 12%
Utah Highlands Canopy Cover Composited Using Three Lifeform Dataset
Step 4. Canopy Height • Assign life-form specific height classes to plots in modified MAT as defined by the Vegetation Working Group • Extract digital values from the spatial data layers, including life-form specific cover types • Run decision tree model separately for the three life forms • Generate life-form specific cross-validation error matrices for height classes • Generate life-form specific height class spatial data using decision tree • Check for errors in the three life form-specific height maps • Mask each height map with water, urban, and agriculture masks
Step 4. Canopy Height Height Classes (LANDFIRE Vegetation Working Group) Forest 0-5 Meters 5-10 Meters 10-25 Meters 25-50 Meters > 50 Meters Shrub 0-0.5 Meters 0.5-1.0 Meters 1.0-3.0 Meters > 3.0 Meters Herbaceous 0-0.5 Meters 0.5-1.0 Meters > 1.0 Meters
Tree: Height > 10m, Canopy > 40% Tree: Height > 10m, Canopy <= 40% Tree: Height <= 10m, Canopy > 40% Tree: Height <= 10m, Canopy <= 40% Shrub: Height > 1m, Canopy > 40% Shrub: Height > 1m, Canopy <= 40% Shrub: Height <= 1m, Canopy > 40% Shrub: Height <= 1m, Canopy <= 40% Herbaceous: Height > 0.2m, Canopy > 40% Herbaceous: Height > 0.2m, Canopy <= 40% Herbaceous: Height <= 0.2m, Canopy > 40% Herbaceous: Height <= 0.2m, Canopy <= 40% Barren land Water Permanent snow and ice Agriculture Residential and commercial lands Utah Highlands Structure Stages Utah Existing Structural Stages
Utah Highlands Canopy Structure Stage
Questions, Comments? For Further Information Visit: www.landfire.gov Email: jkost@usgs.gov Thank You!