Download
1 / 26
260 likes | 278 Views
This article discusses the improvements made to the governance and dissemination process of StatLine at Statistics Netherlands. It highlights the challenges faced, the solutions implemented, and the goals achieved, as well as the areas that still need improvement. The focus is on enhancing the quality, efficiency, and accessibility of the StatLine database.

E N D
Improvements to the governance and dissemination process of StatLine, at Statistics Netherlands Drs. Ran van den Boom Statistics Netherlands May 13-15, 2008
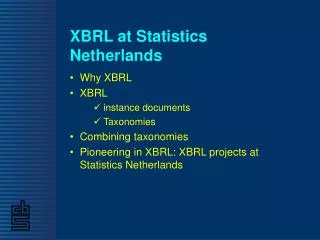
Starting-points, principles • All figures from Statistics Netherlands (SN) should be published on StatLine, the one-and-only database with all SN tables • Special requirements for organisation and IT • SN aims at everyone in The Netherlands and more • The level of visitors varies significantly • We also aim at non-visitors
Starting-points, principles • Budget reductions and tackling administrative burdens (red tape) makes Public Relations (PR) for SN important • One of the means for PR is StatLine, the database of all statistics of SN • Earlier improvements (StatLine 4) did not succeed • Complexity was too large: new process, migration of meta and data, new database format, new software for complete process, coordination of terms at a high level in 1 project
Amongst the solutions • StatLine CoOP • Improve quality and efficiency • Improve accessibility • Make sure software is working up to 2012 • Lessons learned from StatLine 4 • PR through Statistics • Other visualisations • Dedicated websites
Improve quality, efficiency and accessibility • StatLine CoOP programme • Achieving Coordination level 1 Improve comprehensibility and uniformity of the statistics: quality • Improving the Output (dissemination) process Redesign governance of the communication and the dissemination process along with the tools: efficiency • Improving the Presentation of statistics Revise layer around the StatLine database (StatWeb 5) to make it more user-friendly: accessibility • CoOP stands for Cooperation Without it, we would not be successful
Quality Achieving Coordination level 1 Problems • Problems for understanding table explanations • Abbreviations • Officialise, difficult, solemn and old-fashioned words • Technical words • Statistical terms • Quality attention and procedures were focused on paper articles, webarticles; not on StatLine tables • Dissemination department served as Quality Police
Quality Coordination levels • Background: Model for levels of coordination
Quality Achieving coordination level 1Project approach • Facilitated by • Guidelines (level of audience = newsviewers) • Tools • Communication, newsletters each month, open meetings • Overviews of parts of metadata such as titles • Strong cooperation with the seven statistical departments, dissemination department, project team; bottom-up approach • Awarding best effort with a pie each week • To reach level 1 was (and is) difficult: a lot of stakeholders, communication, discussions
Quality Achieving coordination level 1Project results • 900 tables for which text was reviewed, improved and placed in 6 months time • Better explanations • Hardly any abbreviations • More awareness for quality • New, supported, guidelines • Reference texts • Previewing a table before publication • Overview of meta in StatLine available
Quality Achieving coordination level 1Goals not met • Explanations sometimes too large • Guidelines not completely applied • Some inconsistencies still remain • Some statistical departments still busy as a result of other priorities and being understaffed • Tools less successful • Challenge: How to keep the focus and attention for quality? And how to improve quality?
Efficiency Improving the Output (dissemination) process • Reasons to improve the process • Data was stored in > 10 places • Inconsistencies appeared • Administration cumbersome • Uploading data to the website sometimes took too long • Problems maintaining the software in the near future
Efficiency Organisation of dissemination at SN General Director PR Magazine Ext. courses 3 Divisions 7 Statistical departments dealing with dissemination Dissemination department Other departments Communication StatLine Website Yearbook Statistical output Int. courses
Efficiency Improving the process; approach • Quick-wins without adapting the process • Preview of the adapted or new table • Easier administration • Copying deltas to Internet instead of all data • Long term improvements • New governance model • New process, less steps • New roles, quality checks at the beginning • New and adapted tooling, only one administration and a minimum number of table storage locations
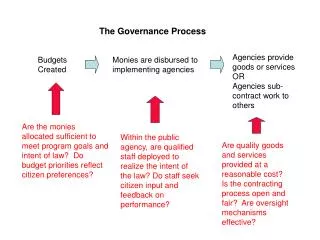
Efficiency The new process • Design and build meta • Announce table and meta (PR & administration) • Build the table and store • Preview • Check, report ready • Check against guidelines • Final preview and check by head of department, report ready, publish automatically Dissemination Department End responsibility for quality Statistical Departments
Efficiency Challenges in implementing new governance model • People, responsibilities, roles • How to help them change? • Process, procedures • How to make it acceptable for all? • Organisation • How to change management? • Facilitating, templates, tools • How to organise without much budget, resources, time? • We’re still busy, using lessons learned, Agile techniques, colour theory (De Caluwé), Prince2, and communication
Accessibility Improving the Presentation of statistics • StatWeb 5 improvements • Part of the overall website • Icons, colours and layout have a modern looking web application • Improves navigation and adds more explanations for inexperienced users • Replaced the Java applet with a more commonly available JavaScript/HTML solution • Performance and scalability • And more…
Accessibility StatWeb 5 Entrance
Accessibility StatWeb 5 Example Change the selection Clear what icons do Explanation
PR through Statistics • Several “special” dedicated websites: • Youth monitor (Jeugdmonitor – Dutch only) • CBS in your neighbourhood (CBS in uw buurt – Dutch only) • Under development: CBS for companies and organisations • Under investigation: StatLine maps • Visualisations, such as Business Cycle clock • Google maps • Google earth (English and Dutch) • Under investigation: banners (using webservices)
Youth monitor • Currently StatWeb 3 underneath • Plans to migrate to webservices and StatWeb 5
CBS in your neighbourhood • Uses Google Maps
Coverage versus level SN Website Dedicated sites • A rough indication; • Gaps to bridge? By us? StatLine Level of audience, ease of understanding Google maps Google earth Microdata Press messages Banners Links Coverage of all details of all statistics
Lessons learned: Things to do • Involvement of the management • Involvement of the end-user • Experienced team leaders • Focus on most important goal • Communication is two-ways • Bottom-up approach • Pro-active on risks • Guidelines, tools ready at the beginning Improving quality and efficiency requires more than just guidelines
Discussion, questions • Does this process and organisation fit? • Would a “Quality Police” still be required? • How to keep attention on quality? • How to increase quality? • Would the results of Achieving level 1 have been better if: • Each table was reviewed after it was improved? • The statistical departments could have been “ordered” to spend more time on quality? At what costs?