Download
1 / 24
240 likes | 600 Views
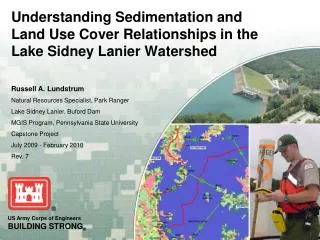
Understanding Sedimentation and Land Use Cover Relationships in the Lake Sidney Lanier Watershed. Russell A. Lundstrum Natural Resources Specialist, Park Ranger Lake Sidney Lanier, Buford Dam MGIS Program, Pennsylvania State University Capstone Project July 2009 - February 2010 Rev. 7.

E N D
Understanding Sedimentation and Land Use Cover Relationships in the Lake Sidney Lanier Watershed Russell A. Lundstrum Natural Resources Specialist, Park Ranger Lake Sidney Lanier, Buford Dam MGIS Program, Pennsylvania State University Capstone Project July 2009 - February 2010 Rev. 7
Lake Sidney Lanier • Located 60 miles north of Atlanta, GA • Buford Dam built in 1952 • Filled to full pool in 1957 • Over 15,000 adjacent land owners • 10,000 private docks • Source of drinking water for 3.5 million people • Over 7.5 million visitors to the lake annually
Lake Level Action Zones Above 1071’: Flood Water Storage Zone 1: Normal Operation Zone 2: Reduced Hydropower, Limited Navigation Zone 3: Reduced Hydropower, Severely Limited Navigation Zone 4: Hydropower at Minimum, Little/No Navigation Below 1035’: Unable to Generate Power, “dead storage” http://water.sam.usace.army.mil
Vital Statistics • 692 miles of shoreline • 39,038 acres of water • 17,726 acres of land • 41 USACE parks • 10 Marinas • 10,000+ Boats • 13 County and City Parks • 6 State Parks
Upper Chattahoochee Watershed 9 counties 1,034 square miles 60 square miles of that is the lake itself 2,240 miles of streams* 3,909 miles of roads** *USGS NHD dataset **TeleAtlas 2009
Research Questions • How has land use changed in the watershed? • How much sediment has accumulated in Lake Sidney Lanier? • Is there a correlation between sediment accumulation and land-cover change in the Lake Sidney Lanier watershed?
Study Area Selection • 44 Sub-watersheds Drain to Lake Sidney Lanier • 4 Selected, Based On: • Sufficient Sedimentation Range data • Max. Accumulation • Max. Erosion • No Change • Visual Analysis of Land Cover Change • New Neighborhoods • More Roads • Forested Areas Longwood Cove, Lake Sidney Lanier 130,000 cubic yards of silt removed
Sediment Affects… • Recreation • Wildlife • Water Supply • Water Quality
Sub-watershed Study Areas 404 801 808 804
Study Area Summary *USACE Allocation Zones
Data Discussion • Land cover • Georgia Land Use Trends (GLUT, University of Georgia, Athens, GA) • Collected 1974, 1991, 2005 • Sedimentation Range • Cross section bathymetric surveys • Located in various creeks impounded by the reservoir • Three data sets: 1956, 1983, 1990
Land Cover Sub-watershed HUC 808 Cumming, GA, 1991
Data Discussion • Land cover • Georgia Land Use Trends (GLUT, University of Georgia • Collected 1974, 1991, 2005 • Sedimentation Range • Cross section bathymetric surveys across lake • Located in various creeks impounded by the lake • Three data sets: 1956, 1983, 1990
SedimentationRanges SR#33A Survey, 1990
Significant Dates for Project Data • 1956 Sedimentation Range Survey, Baseline • 1957 Lake Lanier filled to full pool • 1974 Georgia Land Use Trends Cover • 1983 Sedimentation Range Survey • 1990 Sedimentation Range Survey • 1991 Georgia Land Use Trends Cover • 2005 Georgia Land Use Trends Cover
Methods Land cover change • Visual analysis • Raster analysis • Impervious surfaces • Forested areas • Urban/suburban areas Sediment Range • Drastic increases or decreases in sediment • Identify areas that have certain characteristics • Strong increase • Strong decrease • No change How do the land cover and sediment range data correlate?
Research Relevance • Effect of silt on lake operations • Reduces hydropower capacity • Minimal impact • Effects recreation, wildlife • Shallow water in marinas • Turbid water in creeks and coves • Can impact flood storage • Estimated $2 billion in real estate between Buford Dam and Peachtree Creek • Effects municipal water supply • Reduces water storage capacity • Diffuser pipes become clogged • Additional water treatment for turbid water (minimal on this lake)
Research Relevance • Effect of silt on lake operations • Reduces hydropower capacity • Minimal impact • Effects recreation, wildlife • Shallow water in marinas • Turbid water in creeks and coves • Can impact flood storage • Estimated $2 billion in real estate between Buford Dam and Peachtree Creek • Effects municipal water supply • Reduces water storage capacity • Diffuser pipes become clogged • Additional water treatment for turbid water (minimal on this lake)
Flooding in Mableton, GA, September 2009 Map of home value below Buford Dam Research Relevance • Effect of silt on lake operations • Reduces hydropower capacity • Minimal impact • Effects recreation, wildlife • Shallow water in marinas • Turbid water in creeks and coves • Can impact flood storage • Estimated $2 billion in real estate between Buford Dam and Peachtree Creek • Effects municipal water supply • Reduces water storage capacity • Diffuser pipes become clogged • Additional water treatment for turbid water (minimal on this lake)
Research Relevance • Effect of silt on lake operations • Reduces hydropower capacity • Minimal impact • Effects recreation, wildlife • Shallow water in marinas • Turbid water in creeks and coves • Can impact flood storage • Estimated $2 billion in real estate between Buford Dam and Peachtree Creek • Effects municipal water supply • Reduces water storage capacity • Diffuser pipes become clogged • Additional water treatment for turbid water (minimal on this lake)
Timeline 2009 • July: Research Started • August: Proposal Rough Drafts • September: Online Proposal Presentation • October: Start Research Analysis • November: GIS Day Presentation • December: Continue Research Analysis 2010 • January: Draft Analysis Findings • February 9-11: Final Presentation, USACE South Atlantic Division Ranger Conference in Savannah, GA • March: Project Revisions • April: Final MGIS Wrap-up • May 15: Graduate • June: Present Documents and Research Findings to USACE