Download
1 / 24
240 likes | 340 Views
Explore the impact of changeable speed signs in school zones on driver behavior and safety. Learn about a study evaluating the effectiveness of these signs and their role in Safe Routes to School initiatives.

E N D
The Use of ‘Your Speed’ Changeable Message Signs in School Zones Sarah O’Brien and Carrie Simpson
Introduction – Speed Affects: 30 MPH 15 MPH Driver’s ability to react, braking distance Crash Severity or potential to avoid a crash Driver’s field of vision
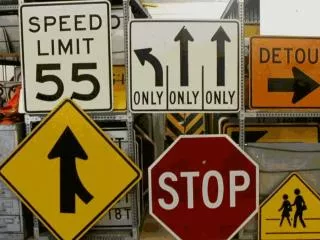
Introduction – Why School Zones? • Lower Speed Limits Around Schools = GOOD • Increased pedestrian activity • More traffic • More turning vehicles • Potentially longer queues
Introduction – Do They Work? www.pedbikeimages.org / Dan Burden • Effectiveness of School Speed Zones = POOR • No change roadway characteristics • No change in environmental setting • Reduced speed ‘feels’ unnatural • Child walkers/bikers are MIA • 48% walked or biked in 1969 • 12% walked or biked in 2009
Safe Routes to School Goals • Enable and encourage children to walk and bicycle to school • Make walking and bicycling to school safer • Implement projects to: • Improve safety • Reduce traffic • Reduce fuel consumption • Reduce air pollution
Speed Feedback Sign Types Images clockwise: Dan Burden, FHWA-HRT-08-067, Dan Burden, and Caltrans via FHWA-SA-07-002
Study Objectives • Do YOUR SPEED signs reduce speeding and increase compliance? • School time vs. non-school time comparison • Lessons learned and future recommendations
SRTS Project Overview • CM Eppes Middle School Site Description • SRTS at CM Eppes • YOUR SPEED Sign Assembly & Operation
CM Eppes Middle School • S. Elm St. • School Zone • 11,000 vpd • 1,500 ft zone • 35 mph, non-ST • 25 mph, ST N
CM Eppes SRTS Project Identify unsafe pedestrian scenarios Participate in International Walk to School Day Start a frequent walker/cyclist program Conduct citation study with local police dept.
Sign Assembly Features and Operations • Steady Number 0 < Speed Limit ≤ 5 mph • Flashing Number Speed Limit ≤ 6 – 20 mph • Flashing Pattern Speed Limit ≤ 21 mph+ • Operate during school times • Breakaway compliant • Collect speed data 23 34 ░
Data Collection Pre-installation; 1, 3, 6 and 12 months post During school time (morning and afternoon) During non-school time (morning and afternoon) Both directions of travel
Data Analyzed % exceeding the speed limit Average speed 85th percentile speed Standard deviation Pace speed Data grouped by school time, non-school time, and direction of travel
Conclusions • Yes, YOUR SPEED signs worked! • Significant, sustained reductions in speed • Avg. speed was 12% lower 1 yr after install • Enhance Effectiveness: • Periodic police presence • Active SRTS Program (encouragement/education)
Conclusions • Additional Research Needs • Context sensitivity: Do they work in all school settings? • Optimal speed enforcement strategy (frequency of police presence with use of sign) • Comparison to other possible traffic calming techniques
Contact Information Carrie L. Simpson NC Department of Transportation – Safety Evaluation Group clsimpson@ncdot.gov 919-662-4067 • Sarah Worth O’Brien • Institute for Transportation Research and Education • skworth@ncsu.edu • 919-515-8703