Download
1 / 28
280 likes | 436 Views
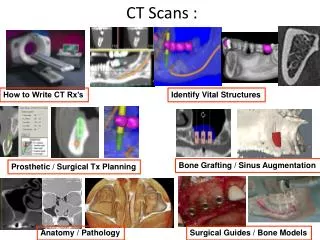
CANCER RISK IN CHILDREN EXPOSED TO CT SCANS. Allison Low 3.10.2013. Clinical Question. Do CT scans in children and adolescents increase their subsequent risk of developing cancer? P - children and adolescents I - CT scans C - no CT scans O - cancer. Clinical cases.

E N D
CANCER RISK IN CHILDREN EXPOSED TO CT SCANS Allison Low 3.10.2013
Clinical Question • Do CT scans in children and adolescents increase their subsequent risk of developing cancer? • P - children and adolescents • I - CT scans • C - no CT scans • O - cancer
Clinical cases • 13 year old boy with an incidental finding of papilloedema, neurological examination otherwise normal • 4 year old girl, RTA, GCS of 9, visible head injury, no external abdominal injuries, haemodynamically stable
Methods • population based, cohort, data linkage study • Australia • 10.9 million people aged 0-19 (Medicare) over a 20 year period ending in 2005 • monitoring until 2007
Methods • Medicare records record all (funded) CT scans • Australian Cancer Database (ICD-10 codes) • socioeconomic status from SEIFA
Methods - missed scans • state-based tertiary hospitals (not on records) • scans outside of Australia
Analysis • one year lag period (also five and ten year lags) • IRRs exposed vs unexposed • dosage: estimate by site, year of scan, age (changed after 2001)
Results • mean length of follow up: 17.3 years (unexposed), 9.5 years (exposed) • 3150 exposed individuals developed cancer • 57 524 non-exposed developed cancer • overall, IRR 24% higher in exposed group (IRR 1.24, 95% CI 1.20-1.29)
Other results • IRR increased with each additional CT scan (0.16 , 95% CI 0.13-0.19) • IRR increased for all cancers combined, also for all solid organ cancers, all lymphoid and haematopoeitic cancers • site-specific eg leukaemia after CT abdo/pelvis • gender difference for non-brain solid organ tumours: F>M (1.23) • socioeconomic status: no significant difference
Brain cancer • brain cancer - highest risk 1-4 years after exposure, higher risk for 15 years • under five years riskiest • ? reverse causation - analysis repeated excluding all brain cancers after CT brain - 1.20, 95% CI 1.15-1.24
X X
X X
Discussion points • (no trauma CT patients with subsequent leukaemia in Sheffield...) • Image Gently/ALARA • CT scans vs clinical skill