Download
1 / 22
220 likes | 340 Views
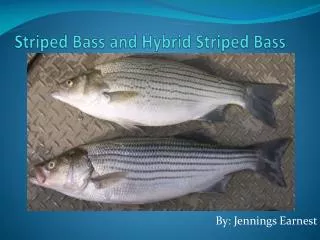
TWENTY-ONE YEARS OF HYBRID STRIPED BASS CULTURE IN THE U.S. (1987-2007). By James M. Carlberg, Michael J. Massingill, and Jon C. Van Olst Kent SeaTech Corporation. Data from state Aquaculture Extension Programs and a survey of major producers. Kent SeaTech Corporation.

E N D
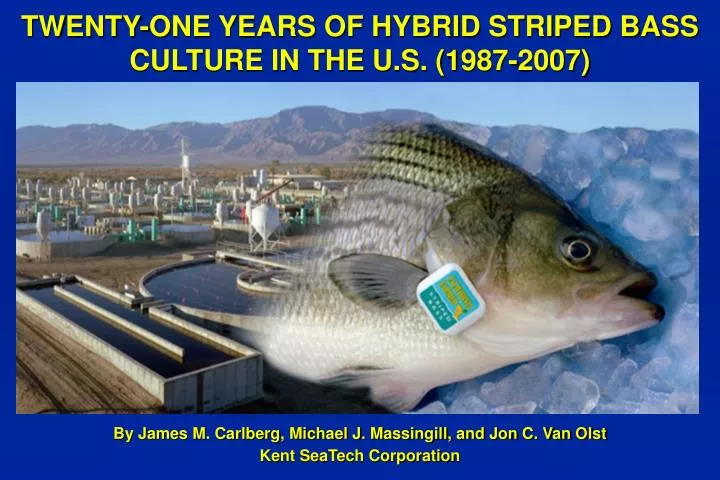
TWENTY-ONE YEARS OF HYBRID STRIPED BASS CULTURE IN THE U.S. (1987-2007) By James M. Carlberg, Michael J. Massingill, and Jon C. Van Olst Kent SeaTech Corporation
Data from state Aquaculture Extension Programs and a survey of major producers Kent SeaTech Corporation U. S. Production of Hybrid Striped Bass During 2007 155,000 lb 404,000 lb 4,952,000 lb 3,031,000 lb 2,698,000 lb U.S. Total = 11,240,000 lb
Data from state Aquaculture Extension Programs and a survey of major producers Kent SeaTech Corporation U. S. Production of Hybrid Striped Bass During 2007 Upper Midwest Region Production (lb) Ponds 0 Tanks 0 Cages 155,000 Total 155,000 Northeast Region Production (lb) Ponds 4,000 Tanks 400,000 Cages 0 Total 404,000 U.S. Total Production (lb) Ponds 8,572000 Tanks 2,513,000 Cages 155,000 Total 11,240,000 Mid-Atlantic Region Production (lb) Ponds 3,031,000 Tanks 0 Cages 0 Total 3,031,000 Western Region Production (lb) Ponds 3,361,000 Tanks 1,591,000 Cages 0 Total 4,952000 Southeast Region Production (lb) Ponds 2,176,000 Tanks 522,000 Cages 0 Total 2,698,000
Cages Ponds Tanks Data from state Aquaculture Extension Programs and a survey of major producers Kent SeaTech Corporation Production of Hybrid Striped Bass (lb) 12,000,000 10,000,000 8,000,000 6,000,000 4,000,000 2,000,000 '00 '04 '06 '86 '88 '90 '92 '94 '96 '98 '02
Data from state Aquaculture Extension Programs and a survey of major producers Kent SeaTech Corporation Production of Hybrid Striped Bass (lb)
Data from state Aquaculture Extension Programs and a survey of major producers Kent SeaTech Corporation Changes in Production Methods for Hybrid Striped Bass
Data from state Aquaculture Extension Programs and a survey of major producers Kent SeaTech Corporation Regional Production and Sales of Hybrid Striped Bass (2007) Northeast Mid-Atlantic Southeast Midwest West Total Fresh (lb) 4,000 1,830,000 2,660,000 0 4,657,000 9,151,000 Live (lb) 400,000 1,201,000 38,000 155,000 295,000 2,089,000 Total (lb) 404,000 3,031,000 2,698,000 155,000 4,952,000 11,240,000 Fresh (% of US market) 0% 20% 29% 0% 51% 100% Live (% of US market) 19% 57% 2% 7% 14% 100% Total (% of US market) 4% 27% 24% 1% 44% 100% Fresh:Live Sales Ratio 1:99 60:40 99:1 0:100 94:6 81:19 (within production region)
Data from state Aquaculture Extension Programs and a survey of major producers Kent SeaTech Corporation Changes in Regional Productionand Sales of Hybrid Striped Bass Northeast Mid-Atlantic Southeast Midwest West Total 2006 Fresh (lb) 25,000 2,225,000 2,095,000 0 5,389,000 9,734,000 Live (lb) 389,000 1,281,000 14,000 220,000 287,000 2,191,000 Total (lb) 414,000 3,506,000 2,109,000 220,000 5,676,000 11,925,000 2007 Fresh (lb) 4,000 1,830,000 2,660,000 0 4,657,000 9,151,000 Live (lb) 400,000 1,201,000 38,000 155,000 295,000 2,089,000 Total (lb) 404,000 3,031,000 2,698,000 155,000 4,952,000 11,240,000 Change Fresh (lb)- 21,000- 395,000 + 565,000 0 - 732,000 - 583,000 Live (lb)+ 11,000 - 80,000 + 22,000 - 65,000 + 8,000 - 102,000 Total (lb)- 10,000- 475,000 + 587,000 - 65,000- 724,000- 685,000 - 2%- 14% + 28% - 30%- 13%- 6% Increase Decrease
Data from state Aquaculture Extension Programs and a survey of major producers Kent SeaTech Corporation Changes in Sales of Hybrid Striped BassDuring 1996-2007 (pounds/year)
Data from state Aquaculture Extension Programs and a survey of major producers Kent SeaTech Corporation Changes in Wholesale Prices of FarmedHybrid Striped Bass (2006-2007) Farm Location Northeast Mid-Atlantic Southeast Midwest West Average Fresh (FOB Farm) $2.55/3.00 $2.71 /2.90 $2.66/2.92(na) $2.56/2.53 $2.62/2.72 + .45+ .19 + .26 -- - .03 + .10 Fresh (Delivered) $ 2.81/3.50 $2.86/3.10 $2.91/3.16 (na) $2.82/2.93 $2.85/3.03 + .69 + .24 + .25 -- + .09 + .18 Live (FOB Farm) $3.55/3.75 $3.02/3.00 $3.22/$3.25 $3.00/3.00 $3.54/3.00 $3.18/3.15 + .20- .02 + .03-- - .54 - .03 Live (Delivered) $4.34/4.20 $3.42/3.40 $3.50/$3.60 $3.40/3.40 $4.20/3.51 $3.69/3.32 - .14 - .02 + .10-- - .69 - .37 2006 Price increase between 2006 and 2007 2007 Price decrease between 2008 and 2007
Data from state Aquaculture Extension Programs and a survey of major producers Kent SeaTech Corporation Price-Volume Relationship for FarmedHybrid Striped Bass During 1984-2007 14,000,000 12,000,000 10,000,000 Annual Volume (lb) 8,000,000 6,000,000 4,000,000 2,000,000 $5.00 $4.50 Fresh Sales Price FOB Farm ($/lb) $4.00 $3.50 $3.00 $2.50 $2.00 ’00 ’01 '84 '85 '86 '87 '88 '89 '90 '91 '92 '93 '94 '95 '96 '97 '98 ’03 ’05 ’06 ’07 ’08 '99 ’02 ’04
$5.00 $4.50 $4.00 $3.50 $3.00 $2.50 $2.00 Data from state Aquaculture Extension Programs and a survey of major producers Kent SeaTech Corporation Price-Volume Relationship for FarmedHybrid Striped Bass During 1984-2008 Sales Price ($/lb) 14,000,000 2,000,000 4,000,000 6,000,000 8,000,000 10,000,000 12,000,000 Annual Production (lb)
14,000,000 12,000,000 10,000,000 8,000,000 6,000,000 4,000,000 2,000,000 0 Data from state Aquaculture Extension Programs and a survey of major producers Kent SeaTech Corporation U. S. Production of Hybrid Striped BassDuring 2007 and Projections for 2008 New Production Existing Production 11,980,000 11,240,000 640,000 Annual Production (lb) 2007 2008 (Actual) (Projected)
CHANGES IN THE ECONOMICS OF HYBRID STRIPED BASS CULTURE DURING 1996-2005
CHANGES IN THE ECONOMICS OF HYBRID STRIPED BASS CULTURE DURING 1996-2005
INCREASES IN PRODUCTION COSTS IN INTENSIVE TANKS AND OPEN POND HSB FARMING
Increases in the Costs of Hybrid Striped Bass Culture During 1997-2005 TANK CULTURE POND CULTURE
Kent SeaTech Corporation HYBRID STRIPED BASS FRY AND FINGERLINGS PRODUCED BY SEVEN U.S. GROWERS IN 2007
Cost of Production and Market Price of Hybrid Striped Bass During 2005
Worldwide Production of Hybrid Striped Bass in 2005 (million pounds/yr)
IMPORTS OF CULTURED HYBRID STRIPED BASS FROM TAIWAN
Kent SeaTech Corporation SUMMARY AND CONCLUSIONS MARKET TRENDS: Increased Demand for Center-of-the-Plate, High-Quality Fresh Fish Steady Increase in Demand for Live Fish and Higher Pricing Positive Conditions and Opportunity to Expand Competition with Wild-Caught Striped Bass Competition with Cheaper Live Fish Alternatives Need to Increase Perceived Value of Farm-Raised HSB Concerns about Possible Economic Recession PRODUCTION CONCERNS: Continued Source of High Quality Fingerlings High Cost of Production Inputs (Feed, Electricity, Oxygen, etc.) Regulatory Issues Affecting Water Use and Discharge (Need for BMP’s)