Download
1 / 19
190 likes | 388 Views
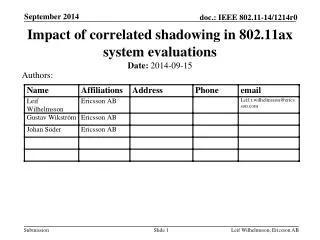
Impact of correlated shadowing in 802.11ax system evaluations. Date: 2014-09-15. Authors:. Abstract. In this contribution we compare some simulation results for Box 1 calibration with what is obtained if one instead of uncorrelated shadowing would account for spatial correlation.

E N D
Impact of correlated shadowing in 802.11ax system evaluations • Date:2014-09-15 Authors: Leif Wilhelmsson, Ericsson AB
Abstract • In this contribution we compare some simulation results for Box 1 calibration with what is obtained if one instead of uncorrelated shadowing would account for spatial correlation. • For the edge users (5%-tile) a significant difference is seen. • We also propose a simple way to implement correlated shadowing in system simulators Leif Wilhelmsson, Ericsson AB
Leif Wilhelmsson, Ericsson AB Contents • Background • Uncorrelated vs. Correlated Shadowing • Some numerical examples for Box1, Enterprise scenario • Proposal for how to model correlated shadowing • Correlation Map • Calculation of link shadowing component
Leif Wilhelmsson, Ericsson AB Background • In [1], it was argued that uncorrelated shadowing may give unrealistic results. In an attempt to somewhat reduce this issue it was proposed to reduce the variance of the shadowing for LNOS • In [9], uncorrelated shadowing is still assumed, and it has been decided not to solve the above issue by changing parameters in well-established models • In [2] significant efforts are made to ensure accurate results. For instance by considering SINR on individual sub-carriers rather than just average pathloss. To motivate these efforts it seems appropriate not to oversimplify other parts and by that somewhat reduce the significance of the obtained numerical results
Uncorrelated shadowing Point B The shadow fading for links AC and BC are taken as independent random log-normal variables. This implies no correlation between a node’s gain to different transmitters Point A BC AC Point C Mappingof positions
John Doe, Some Company Correlated Shadowing • Typically, different radio links to the same node are assumed to have correlated radio properties, i.e., the shadow fading models the local environment which should remain constant. For instance, if a node is in a drawer, all its links should be affected • Two radio links that are very similar in the spatial domain can be expected to experience similar shadowing
John Doe, Some Company Correlated shadow fading • Correlated shadow fading is described in [5] - [8] • The shadow fading variation is characterized by the correlation distance meaning that the random map is autocorrelated for distances d with the distribution [7] • Each node has a shadow fading realization and for each pair of nodes the link shadow gain is an equal weight combination of both nodes realizations
Correlated shadow fading The shadow fading is taken as a combination of map values for A and C for link AC and B and C for link BC in order to capture correlations. This means less difference between AC and BC Point B Point A BC AC Randomlog-normal map with correlated values A B Point C C Mappingof positions
John Doe, Some Company Correlated shadow fading – impact on SINR • The reduced variation in gain to different transmitters for a node will result in smaller tails in the SINR distribution, as S and I will vary in the same direction to a larger extent. • To exemplify, we have used a shadowing with a correlation distance γ=1 m and 10 m, representing the range of typical values [7] • The total shadow fading is taken as the equal weighted sum of the values for each pair of nodes
John Doe, Some Company Results for correlated shadow fadingTest 2 – DL only At the 5th percentile the uncorrelated fading underestimates the SINR up to 5 dB
John Doe, Some Company Results for correlated shadow fadingTest 3 – UL only At the 5th percentile the uncorrelated fading underestimates the SINR up to 4 dB
Leif Wilhelmsson, Ericsson AB Proposal • It is proposed to use correlated shadowing in the systems evaluations to better reflect real world conditions • It is proposed to calculated the shadowing for the individual links by: • 1) Generating a map for the scenario where a shadowing value is associated with a location, and where the correlation in spatial domain is achieved by filtering • 2) For each link calculate the shadowing by the average of the shadowing values as the corresponding nodes • What correlation distance to use is still TBD, and it is expected that different scenarios will need different values
John Doe, Some Company References • [1]“Path loss model for scenario 1”, N. Jindal and R. Porat, IEEE 802.11-14/0577r1 • [2] “11ax evaluation methodology”, R. Porat et al., IEEE 802.11-14/0571r3 • [3] “Box 1 and Box 2 calibration results”, N. Jindal et al., IEEE 802.11-14/0800r15 • [4] “TGax simulation scenarios”, S. Merlin et al., IEEE 802.11-14/0980r0 • [5] “Correlation model for shadow fading in mobile radio systems”, M. Gudmundson, Electronic Letters,pp. 2145-2146, November, 1991. • [6] “Further advancements for E-UTRA physical layer aspects”, 3GPP TR-36-814 • [7] “Coordinated multi-point operation for LTE physical layer aspects”, 3GPP TR 36.819 v11.0 • [8] “Correlation properties of large scale fading based on indoor measurements”,N. Jalden, P. Zetterberg, B. Ottersten, A. Hong, and R. Thomä, IEEE WCNC, March 2007 • [9] “IEEE 802.11ax channel model document”, J. Liu et al. IEEE 802.11-14/0882r11
Leif Wilhelmsson, Ericsson AB BACKUP SLIDES
John Doe, Some Company Numerical examples: Box 1 calibrations • In our system simulator we have implemented the Enterprise scenario (ss2) [1] and evaluated the five tests specified for the Box 1 calibration as described in [2]. • Results are compared to those from other companies compiled in [3] in case of uncorrelated shadowing. • The simulations are then redone, but with correlated shadowing to see the impact. For purpose of illustration we have used correlation distance 1m and 10m.
Box 1calibraiton Test 1 Test 2
Box 1calibraiton Test 3 Test 4 DL
Box 1calibraiton Test 4 UL Test 5 DL
Box 1calibraiton Test 5 UL