

Introduction
E N D
Presentation Transcript
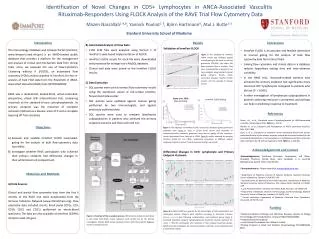
The Immunology Database and Analysis Portal (ImmPort; www.immport.niaid.nih.gov) is an NIAID-funded public database that provides a platform for the management and analysis of clinical and mechanistic data from clinical trials. Here, we assessed the use of Flow-Cytometry Clustering without K (FLOCK), an automated flow cytometry (FCM) analysis pipeline in ImmPort, for the re-analysis of bulk FCM data from the Rituximab in ANCA-Associated Vasculitis (RAVE) trial (NCT00104299). RAVE was a randomized, double-blind, active-controlled, prospective, phase II/III interventional trial, comparing rituximab to the standard-of-care cyclophosphamide. Its primary endpoint was the induction of complete remission (defined as a disease score of 0 and a complete tapering off from steroids). References Objectives B) Automated Analysis of Flow Data 1150 FCM files were analyzed using Version 1 of ImmPort’s web-based implementation of FLOCK. ImmPort FLOCK results for each file were downloaded and processed for storage into a MySQL database. Clinical trial data were joined to the ImmPort FLOCK results. C) Data Extraction SQL queries were used to extract flow cytometry results using the expression values of cell-surface proteins, forward and side-scatter. SQL queries were validated against manual gating performed by two immunologists, and against previously published data. SQL queries were used to compare lymphocyte subpopulations in patients who achieved the primary endpoint outcome and those who did not. Materials and Methods Results Conclusions ImmPort FLOCK is an accurate and feasible alternative to manual gating for the analysis of bulk flow cytometry data from clinical trials. Linking flow cytometry and clinical data in a database reduces hypothesis testing time and inter-observer variability. In the RAVE trial, rituximab-treated patients who achieved the primary endpoint had significantly more total and CD5+ lymphocytes compared to patients who did not (P < 0.001). Further investigation of lymphocyte subpopulations in patients achieving remission is warranted, and perhaps can help in predicting response to treatment. Introduction Stone, J.H., et al., Rituximab versus Cyclophosphamide for ANCA-associated vasculitis. N Engl J Med, 2010. 363(3): p. 221-32. Berden, A., et al., Diagnosis and management of ANCA associated vasculitis. BMJ, 2012. 344. Qian, Y., et al., Elucidation of seventeen human peripheral blood B-cell subsets and quantification of the tetanus response using a density-based method for the automated identification of cell populations in multidimensional flow cytometry data. Cytometry Part B: Clinical Cytometry, 2010. 78B(S1): p. S69-S82. Acknowledgements and Contact Acknowledgements: Northrop Grumman Corporation, Jeff Wiser, Elizabeth Thomson, Patrick Dunn, John Campbell, Li Li, Sanchita Bhattacharya, Rachel Finck, Peter Brodin. Correspondence to: Mazen Nasrallah; mazenn@stanford.edu 1Department of Pediatrics, Division of Systems Medicine, Stanford University School of Medicine, Stanford, CA 94305, USA 2 Stanford Center for Biomedical Informatics Research, Department of Medicine, Stanford University School of Medicine, 251 Campus Drive, Stanford, CA 94305, USA 3 Lucile Packard Children’s Hospital, 725 Welch Road, Palo Alto, CA 94304 USA 4 Department of Medicine, Division of Immunology and Rheumatology, Stanford University School of Medicine, Stanford, CA, 94305, USA § Current Institution: Department of Medicine, Cleveland Clinic Foundation, Cleveland, OH 44195, USA Evaluate and validate ImmPort FLOCK automated-gating for the analysis of bulk flow-cytometry data from RAVE Investigate whether RAVE participants who achieved their primary endpoint had differential changes in their white blood cell compartment Stanford University School of Medicine Mazen Nasrallah1-4,§, Yannick Pouliot1-3, BjörnHartmann4, Atul J. Butte1-3 Identification of Novel Changes in CD5+ Lymphocytes in ANCA-Associated Vasculitis Rituximab-Responders Using FLOCK Analysis of the RAVE Trial Flow Cytometry Data Funding Validation of ImmPort FLOCK Figure 2 Thedatabase of ImmPort FLOCK results was validated against manual gating on the basis of size and granularity (FSC/SSC). We chose 100 flow cytometry files at random. They were independently analyzed by two immunologists using standard manual gating software. Results shows correlation between ImmPort FLOCK analysis and the average of manual results. Stone et al. 2010 Manual Gating ImmPort FLOCK Gating B A Figure 3 Thedatabase of ImmPort FLOCK results was validated against previously published data.Panel A: drop in CD19+ B-cell counts with rituximab or cyclophosphamide treatment generated using manual gating of flow cytometry results (reproduced from Stone et al. 2010). Panel B: results obtained by querying ImmPort FLOCK for the CD19+ lymphocyte population in different patient subgroups. Results in panels C and D represent median cell counts. Differential Changes in CD5+ Lymphocyte and Primary Endpoint Outcome A A) Data Sources Clinical and partial flow cytometry data from the first 6 months of the RAVE trial were downloaded from the Immune Tolerance Network (www.itntrialshare.org). Flow cytometry data included the B1 B-cell panel (CD1c, CD5, CD19, CD23 and CD21) performed on whole-blood specimens The data are also available at ImmPort (iSDY91; immport.niaid.nih.gov). B Figure 4 ImmPort FLOCK was queried for the percentages of total lymphocytes and lymphocyte subsets. Patients were stratified according to treatment outcome (failure, success), days following randomization, and treatment group. Panel A: rituximab treatment. Panel B: cyclophosphamide treatment. Results represent the mean ± SEM for participants who remained in their original treatment groups. Significance values between the success and failure outcomes were calculated using a mixed linear model. • National Institutes of Allergy and Infectious Diseases, Division of Allergy, Immunology and Transplantation, contract HSN272201200028C • Hewlett Packard Foundation • Lucile Packard Foundation for Children's Health • Training Program in Adult and Pediatric Rheumatology 2T32AR050942-06A1 Figure 1. Overview of the re-analysis process. White arrows represent work done in this study. Solid Black arrows represent work carried out by the primary investigators. Dashed black arrows represent future work that could be triggered by the re-analysis process.


