Multivariate community analysis
Multivariate community analysis. Similarity ANOSIM Cluster analysis Ordination. Similarity. Presence/absence Distance coefficients. Similarity: presence/absence. Jaccard = number of species in both = 80% total number of species. Similarity: distance.


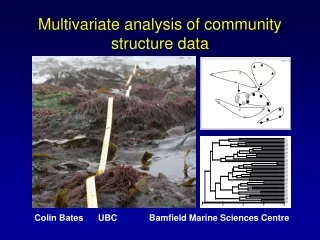
Multivariate community analysis
E N D
Presentation Transcript
Similarity • ANOSIM • Cluster analysis • Ordination
Similarity • Presence/absence • Distance coefficients
Similarity: presence/absence Jaccard = number of species in both = 80% total number of species
Similarity: distance Bray-Curtis= sum of absolute differences = 13 total abundances (38+31)
Similarity matrix All pairwise combinations, excluding repeats and diagonal
ANOSIM (Analysis of similarity) 1. Rank all pairwise combinations of species by their similarity. Therefore rank 1 means the most similar. 2. Divide the pairwise combinations into two types: between groups and within groups. 3. Calculate the mean rank for each type. The smaller the rank, the more similar!
ANOSIM (Analysis of similarity) R = mean rank between groups - mean rank within groups correction factor for number of combinations
ANOSIM (Analysis of similarity) Same! • R = • mean rank between groups - mean rank within groups • correction factor for number of combinations • If no effect of groups expect R=0.
ANOSIM (Analysis of similarity) • R = • mean rank between groups - mean rank within groups • correction factor for number of combinations • If no effect of groups expect R=0. • If within groups are more similar than between groups, expect R>0. Big (dissimilar) Small (similar)
ANOSIM (Analysis of similarity) How to test for significance? Randomisation test! In the following data, three groups were composed of 5, 7, and 5 samples and gave an R of 0.264. What is the likelihood of obtaining this R by chance division of the dataset into three “groups” of 5,7 and 5 samples? There are 2450448 possible ways to divide the dataset into 5,7,5 “groups”. Randomly select 999 of these, calculate R.
Null “groups” R Real group R (0.26) 12 out of 999 permutations (1.3%) are greater than 0.26
Global Test Sample statistic (Global R): 0.264 Significance level of sample statistic: 1.3% Number of permutations: 999 (Random sample from 2450448) Number of permuted statistics greater than or equal to Global R: 12 Pairwise Tests R Significance Possible Actual Number >= Groups Statistic Level % Permutations Permutations Observed A, B 0.175 9.7 792 792 77 A, C 0.592 0.8 126 126 1 B, C 0.147 11.5 792 792 91
Cluster analysis -nearest neighbour Similarity matrix 0.67 Distances are 1- similarity Site A Site C 0.44 0.78 0.54 0.18 Site B 0.21 Site D
Cluster analysis -nearest neighbour 0 Similarity matrix Similarity 0.78 1 A B 0.67 Distances are 1- similarity Site A Site C 0.44 0.78 0.54 0.18 Site B 0.21 Site D
Cluster analysis -nearest neighbour 0 Similarity matrix Similarity 0.67 1 C A B 0.67 Distances are 1- similarity Site A Site C 0.44 0.78 0.54 0.18 Site B 0.21 Site D
Cluster analysis -nearest neighbour 0 Similarity matrix 0.44 Similarity 1 C D A B 0.67 Distances are 1- similarity Site A Site C 0.44 0.78 0.54 0.18 Site B 0.21 Site D
Cluster analysis-furthest neighbour 0 Similarity matrix 0.54 Similarity 1 C A B 0.67 Distances are 1- similarity Site A Site C 0.44 0.78 0.54 0.18 Site B 0.21 Site D
Cluster analysis - average linkage 0 Similarity matrix Similarity 0.61 0.61 0.195 1 C A B Distances are 1- similarity Site A Site C 0.44 0.61 0.78 Site B 0.195 Site D
Ordination Site A Site C Site B Site D Plot the most similar sites closest to each other - can be multidimensional