Download
1 / 35
350 likes | 515 Views
Challenges to the London Plan: Population and Household Forecasts in the Light of the 2001 Census John Hollis London School of Economics Lent Term Seminars 24 February 2003. Timetable of London Plan Demographic Work. June 2000 GLA 2000 Round of Demographic Projections

E N D
Challenges to the London Plan:Population and Household Forecasts in the Light of the 2001 CensusJohn HollisLondon School of Economics Lent Term Seminars24 February 2003
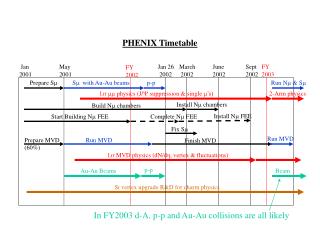
Timetable of London Plan Demographic Work • June 2000 GLA 2000 Round of Demographic Projections • May 2001 Towards the London Plan • October 2001 Expert Panel on average household size, etc • March 2002 Planning for London’s Growth • May 2002 SDS Technical Report 5 • June 2002 draft London Plan • January 2003 GLA 2002 Round of Demographic Projections and SDS Technical Report 23 (2001 MYE) • February 2003 Update to SDS TR 23 (2001 KS)
Some Basic Premises All work at borough level Use of latest official ONS/ODPM data throughout: • ONS vital statistics • Migration based on MYE change analysis, International Passenger Survey, Patient Records and AS/VS • DETR 1996-based household representative rates • GAD marital status, fertility and mortality forecasts Assumptions consistent with GAD/ONS/ODPM • ie Projected migration based on latest 5-years data However ….
Some Problem Areas • Inconsistencies between ODPM household and dwelling estimates with: • Survey of English Housing household estimates • Survey of English Housing average household size • Council Tax Dwelling stocks • Expert Panel discussion • A major pragmatic decision required: • The future level of average household size? • Different age/gender structure from ONS .. • .. therefore different household projection from ODPM
GLA 2000 Round Demographic Projections • Projection 1B – based on London’s Housing Capacity 1996-2016 • Projection 2 – based on average migration patterns of 1993-98 • Results for 2016: • P1B: Population 7.60 m: Households: 3.34 m • P2: Population 8.15 m: Households: 3.59 m • Towards the London Plan • ONS/DETR 1996-based • Population: 7.61 m: Households 3.52 m
Scenario 8.1 (June 2001) Inner, Outer and Greater London as 2000 Round P2 After 1996 Inner/Outer P2 results redistributed to Inner/Outer boroughs according to P1B borough results Shifted 2016 population away from K&C (52k), Westminster (65k), Barnet (52k) and Richmond (39k) Shifted 2016 population to Islington (24k), Tower Hamlets (32k), B&D (30k) and Greenwich (30k)
London Average Household Size ODPM SEH GLASc8.1 1991 2.39 2.39 1994 2.40 1995 2.38 1996 2.32 2.39 2.35 1997 2.32 2.38 1998 2.32 2.39 1999 2.30 2.39 2000 2.28 2.39 2001 2.282.34
Benchmarking Scenario 8.1 Households (AHS = 2.35) (000s) Original Benchmarked 1996 2966 2966 2001 3125 3110 2016 3592 3421 D 2001-16 467 311 D Per annum 31.1 20.7
SDS Technical Report 5 (May 2002) Population Households 2001 7.411m 3.110m 2016 8.149m 3.421m • D 0.738m 0.311m • 455k household increase 1996-2016 – 23k per year
2001 Census/MYE – Sept/Oct 2002 • 2001 MYE: 7.188 m cf approx 7.475 m • 1991 MYE also reduced by 60 k • Growth since 1991 reduced by 225 k to 360 k • International migration +465 k rather than +690 k • ‘Loss’ of young males • Younger and more female population • ‘Losses’ in Westminster (62k), K&C (31k), Barnet (30k) and Richmond (22k) • ‘Gains’ in Tower Hamlets (10k), Brent (10k), B&D (8k) and Southwark (7k)
GLA 2002 Round Demographic Projections • Three variant projections for sensitivity – following GOL/ODPM comments on dLP • Central: average gross and net migration of 1996-2001 after 2001 • Low: International Migration as Central; UK migration based on 2000-01 • High: UK Migration as Central; International migration based on 2000-01 • Population, Households and Economically Active
The London Plan: Revised Forecast • Central Projection basis for Scenario 7.9 Forecast • Borough populations revised to provide a closer match between household projection and ‘London’s Housing Capacity’: 2001-16 • Household projections then ‘benchmarked’ at constant borough 2001 AHS • Overall London AHS of 2.32 • 2001-16 ‘Benchmarked’ household growth: 307 thousand • SDS Technical Report 23
2001 Census: Key Statistics • First results showing some of the variables used in household projections • Communal establishment population • Private household population • Total households • Average household size • Households by type • All of relevance to the London Plan forecast
Communal Establishment Population • 93 thousand – including 6 thousand staff, etc. • London: 1.30% E&W: 1.80% • 34 thousand in Medical/Care Establishments • 53 thousand in ‘Other’ Estabs. Inc students • London Plan: 100 thousand: 1.40% • Therefore a slightly larger private household population at mid-2001: 7.094 million
Households • Key Statistics 3.016 million • Average household size: 2.35 • dLP: 3.110 million: @ 2.35 !!! • SDS TR23: 3.056 million: @ 2.32 • ODPM: 3.121 million: @ 2.27
Households by Type • Key Statistics ‘family’ categories do not absolutely match standard types • Married couples: 1,057 k 1,049k • Cohabiting couples: 299 k 337k <<< • Lone parents: 250 k 263k • 2+ non-family: 364 k 363k • One-person: 1,047 k 1,044k Key Stats SDS TR 23
Impact on the London Plan • 2001 starting level is lower … • … but 2001-16 growth little altered • 2001: 3.023 million households @ AHS 2.35 • 2016 Projection: Range 3.395 m to 3.435 m • Growth: 370-410 k • AHS: 2.27-2.30 • 2016 Benchmarked Forecast: 3.320 m • Growth: 300 k
What are the Risks? • International migration continues to rise .. • .. but .. • .. migration from GL to rest of UK is also rising • Internal migration settles back to around 50k/year • Household formation starts to accelerate
Lessons from 2001 Census – so far • ONS Mid-year Estimates • Who is a resident? • Improve international migration estimates • ODPM • Re-base and rethink household projection model • Review Labour Force Survey results • Re-weight Survey of English Housing • GLA • Increase scepticism of MYE • Utilise a range of indicators: eg Council Tax • The GLA models appear to be robust