Download
1 / 16
160 likes | 305 Views
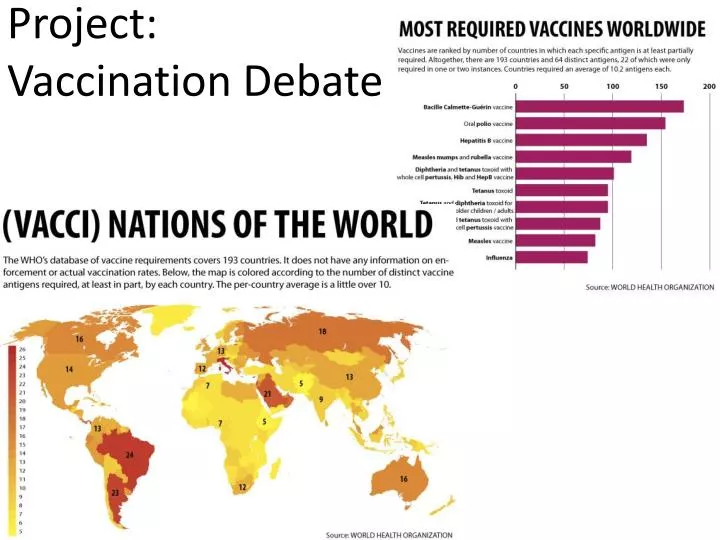
Project: Vaccination Debate. Why is there a debate?.

E N D
Why is there a debate? Project: Your group will need to find an example of a vaccine that is currently available and explore the controversy surrounding this vaccine. You will then use that information to create a media piece to convince the public either to use or avoid the vaccine that your group has chosen to study. Examples: • Create a flyer, video, or audio podcast convincing the public why doctors require or recommend you get the vaccine and include some data comparing its efficacy to its side effects. • Create a flyer, video, or audio podcast demonstrating why people refuse the vaccine, and whether or not there is scientific justification behind their arguments.
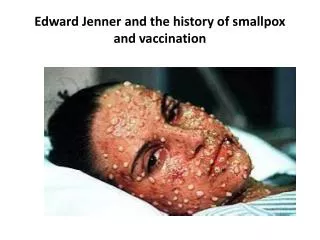
Did Vaccination Really Cause the Decline of Measles? Prior to vaccine development, most people in endemic areas were infected by the age of 15 Many documented outbreaks in naïve populations over past 500 years, some with up to 50% mortality http://www.cdc.gov/measles/about/overview.htm A virus that infects the respiratory system Symptoms: fever, runny nose, cough, blotchy rash More serious complications include ear infection, diarrhea, pneumonia, encephalitis, and miscarriage 1/1000 infected children will die 200,000 deaths/year world wide First described in 9th century AD Has been endemic world wide for centuries
Post-Class Assessment • You’ve had a chance to read the pre-class assignment, today in class we are going to do the assessment together, and then you can turn in your answers at the end of class today.
Pre-Class Question #1-3:Anti-Vac Groups Claim: Measles was already declining when the vaccine was developed, and vaccination had no impact
The Centers for Disease Control Says: http://www.cdc.gov/mmwr (Reported cases) http://www.cdc.gov/vaccines/vac-gen/6mishome.htm#Diseaseshadalready (Graph) Measles was a constant problem before the vaccine became available, and declined sharply afterward. (Questions 4-6)
What’s the Difference? Question #6: change to infection rate. Death rates were declining for all diseases due to advances in medicine, hygiene and nutrition. Measles cases were variable but persistent despite those improvements. Only after widespread vaccination did the number of measles cases decline permanently. Anti-Vac Groups CDC, WHO
What’s the Difference? SCALE- Over a longer time period, the change in death rate appears more dramatic. Looking at a shorter time period (after modern advancements in health) the impact of vaccination is clear. Anti-Vac Groups CDC, WHO
http://www.cdc.gov/mmwr (Reported cases) http://datafinder.worldbank.org/node/547/chart (Vaccination rates) More data from the CDC Bloch, et al. Health impact of measles vaccination in the United States. 1985. Pediatrics 76(4): 524-532.
Pre-Class Question #7:Autism and MMR 1996 2002 1980s 1998 Autism rates in the 1980s (when children received vaccinations against only 7 diseases) were about 0.47 per 1,000 children. Now children regularly receive vaccinations against 14 diseases, and the rate of autism has soared to 6.7 per 1,000 children.
Pre-Class Question #7:Autism and MMR 1984-1988 = 184,822 X 4/1000 = 739 The CDC maintains statistics on disease prevalence, including autism rates. Jacquelyn Bertrand and colleagues report the following statistics for autism prevalence in 1998 along with later studies. Which of the last three studies had the least number of children with autism?
Pre-Class Question #8-9:Autism and MMR 1980s 1996 1998 2002 Confidence Intervals: when we graph the mean, error bars are used to represent the overall distribution of the data and to describe researchers’ confidence that their data represents a true population value. The smaller the sample size, the larger the error bars, the larger the confidence interval (Brick Township).
Pre-Class Question #10:Autism and MMR Despite overwhelming evidence and study showing no link between vaccinations and autism, about 25% of Americans still believe there is a risk. Parents increasingly resist vaccination, and the result in 2008 was the largest U.S. outbreak of measles since 2000 when the native disease was declared to be eliminated.
Correlation and Causation • Google correlate: allows you to upload data on actual events, and determine search terms typed into Google that correlate with those numbers over time. Google's stock price, correlated strongest with web search activity for "solitaire network", a site for those looking to play solo card games online:
Correlation and Causation • List some reasons why we can’t infer that just because two things are correlated, they are not necessarily causing each other?