Download
1 / 24
240 likes | 257 Views
Join the Pacific Water and Wastewater Association (PWWA) in benchmarking efforts to improve utility performance, resolve common issues, and secure financial resources. Explore the three groups of utilities and the improvements recorded through benchmarking. Help us target the poor, correct tariff structures, and work towards sustainable water services.

E N D
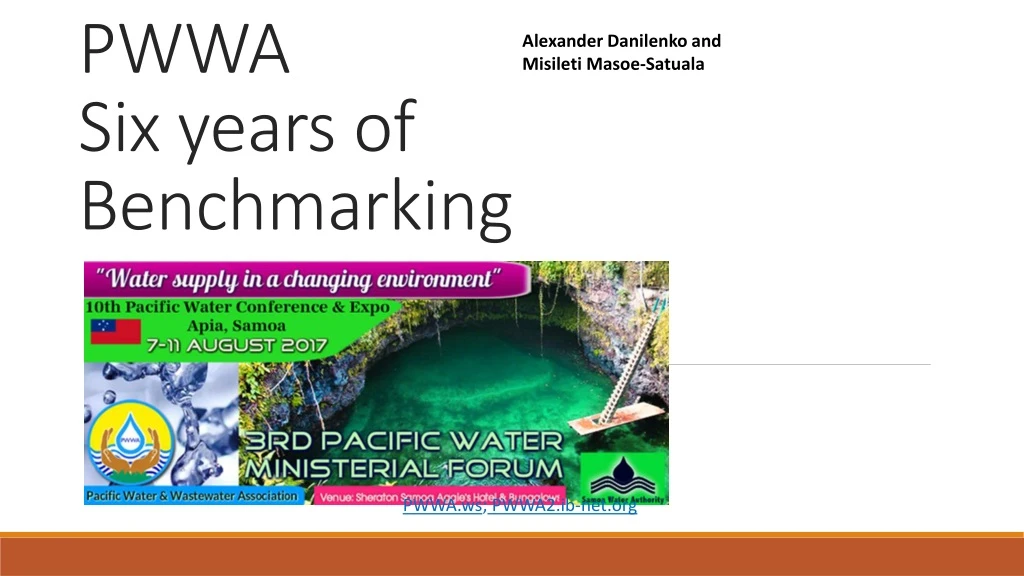
Alexander Danilenko and Misileti Masoe-Satuala PWWA Six years of Benchmarking PWWA.ws; PWWA2.ib-net.org
Key objectives • Make PWWA and utilities known; put them on the world map • Help to improve performance, find common issues and help to resolve them together • Correct and upgrade tariffs • Learn from each other, and seek for help in knowledge and training • Justify investment projects, search for financial resources
Members and participation • 29 water companies • From very small (Niue – 1000 people) • To large (FWA, Fiji – 1 million people) • Three million of people living of the utilities territory • Serving 2.6 million with water services and 1.4 million with wastewater services • Water market size: nearly US$250 million billed annually on average in 2011-2016
Three groups of utilities. Group 1 • Utilities from high income countries (GNI per capita >US$20,000) • Established water and wastewater systems • Highly developed water networks • No or little issues with charging adequate tariffs for services
Three groups of utilities. Group 2 • Utilities from the countries with annual GNI between 10,000-20,000 • Developing water systems; introducing wastewater collection and treatment • Significant issues with coverage and expansion to new customer of many of them • Issues with affordability
Three groups of utilities. Group 3 • Utilities from the countries just started forming water services for all • Significant issues with development of water systems • Almost no wastewater collection, except cleaning latrines • Very high cost of services; issues with water availability and climate change • On the way to become a member of the Group 2
Participation in benchmarking • True leaders in benchmarking work; participated in all rounds of benchmarking in 2010-2016: great kudos for all of you! • ASPA, American Samoa • Eda Ranu, Papua-New Guinea • Water-PNG, Papua-New Guinea • WAF, Fiji • Samoa Water Authority, Samoa • SIWA, Solomon Islands • TWB, Tonga • Majuro, Marshall Islands • Chuuk, FSM • PUB, Kiribati
Recently joined and 5 years of benchmarking Thank you – please keep up and share your data! • New Caledonia • French Polynesia • GWA, Guam • UNELCO, Vanuatu • Central Yap State Public Service (CYSPS), FSM • Tuvalu • Kajur, Marshall Islands • Cook Islands • Niue • IWSA, Samoa • Palau Public Utilities Corporation (PPUC), Palau
We are waiting for you, dear colleagues! • Pohnpei Utilities, FSM • Northern Yap GagilTomil Authority (NYGTA), FSM • Southern Yap Water Authority (SYWA), FSM • Department of Transportation and Infrastructure, Kosrae, FSM • Saipan, Northern Marianna Islands and all others!
Improvements recorded Two companies connected almost 170,000 new customers
Benchmarking brings attention from donors: • New projects started in: • Water-PNG – World Bank (2016) • Kiribati – jointly ADB and World Bank (2017) • WAF – ADB (2016) • TWB – ADB (2016) • Micronesia – ADB (2015-2016) • Prospective projects SIWA – Solomon Islands (jointly ADB and World Bank) • Tariff corrections – in almost every utility • PWWA got funding from AusAID to continue benchmarking
PWWA Tariff database • https://tariffs.ib-net.org/sites/pwwa/Home/IndexPwwa
Information from two databases for tariff efficiency • Revenues • Billing amount • Volume billed • Number of connections • Tariff structure • To know efficiency of tariffs
Estimated Probability Density Function for Utilities American Samoa Eda Ranu PNG Water CAESB
Findings: Majority of Users Consume in 1st block poor 6% poor 30% poor 40% poor 11%
Conclusions • Targeting the poor • Pricing below cost recovery in the 1st block is risky • Consumers of the last block generally tend to be more price-elastic • Depending on one set of consumer class (the high-end consumers) to recover costs is risky
Next steps Data collection 2017 – by December 2017 Tariffs collection 2017 – by November 2017 Training on benchmarking – as per PWWA plan Tariff efficiency assessment – by March 2017 Bi-annual PWWA report draft circulated – June 2017 Bi-annual PWWA report (by the meeting in Noumea) – August 2018