Download
1 / 39
400 likes | 896 Views
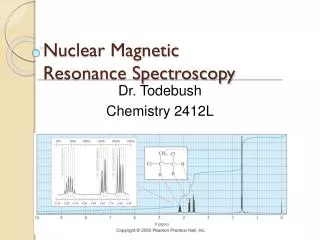
Chapter 14 Nuclear Magnetic Resonance Spectroscopy. “study of interaction of light with molecules ”. 14.1 Proton Magnetic Resonance Spectroscopy. Two or more E states are generated when external magnetic field is applied radio wave absorption between these states NMR spectroscopy.

E N D
Chapter 14 Nuclear Magnetic Resonance Spectroscopy “study of interaction of light with molecules”
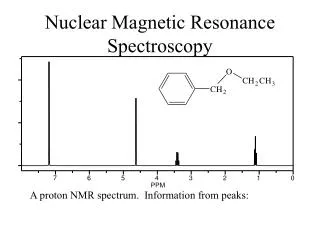
14.1Proton Magnetic Resonance Spectroscopy • Two or more E states are generated when external magnetic field is applied • radio wave absorption between these states • NMR spectroscopy Hydrogen nucleus (1H) and the isotope of carbon (13C) 1H NMR and 13C NMR Three types of information for H NMR spectrum Chemical shift: the carbon to which proton is attached Multiplicity( # of the peaks in each group): neighboring hydrogens Integral: # of hydrogens
Two spin states are generated when external magnetic field is applied ( 546 Figure 14.3) • E (E difference between the two states) = hBo/2 h = plank constant, = magnetogyric ratio (characteristic value for each nucleus) Bo = external magnetic field 14.2 Theory of 1H-NMR
Typical values of E of proton (reference TMS) • External magnetic field 14,000 gauss (or 1.4-tesla) then E =10-6 kcal/mol 60 x 106 s-1 or 60 MHz 46,700 gauss (4.67-tesla) magnet 200 MHz (in this book) 70,000 gauss 300 MHz 9.33-tesla magnetic 400 MHz (in this book) Magnetic field , resolution of NMR to get high magnetic field superconducting maget is needed (superconducting magnet is operated using liquid helium) Magnetic field , $
13C, 19F, 2H and 31P have nuclear spins NMR technique can be applied 12C and 16O do not have nuclear spins no NMR absorption Why? Ask god!
the field required for the hydrogen to resonance varies slightly with the chemical environment of the hydrogen • The required field difference between the hydrogen of the sample and that of TMS (tetramethylsilane) 14.3The Chemical Shift Chemical shift () = ex) 200MHz ( 46,700 gauss) 1H-NMR : aceton peak at 436 Hz (436 x 106/200x106 =2.16 or 2.16 ppm in 300 MHz NMR, this peak will be detected at 654 Hz 548 Figure 14.4
Factors on Chemical Shift () downfield: left on an NMR spectrum deshielded increased external field higher upfield: right on an NMR spectrum shielded decreased external field lower Inductive effect
Pi Electron Effect deshielding effect higher • Exchangeable protons: O-H/N-H (H-bonding) • O-H: 2~5 (ppm), N-H: 1~3, CO2H: ~12 (10~15) • peak position varies
Protons with chemically identical environment Chemical equivalence Three different sets of chemically equivalent protons Three NMR absorptions
Enantiomer: identical chemical shift Diastereomer: different chemical shift Two different sets of chemically equivalent protons two NMR absorptions Three different sets of chemically equivalent protons Three NMR absorptions
one NMR absorption peak two NMR absorption peaks five NMR absorption peak
Estimation of the chemical shift approximate chemical shift of hydrogens
Empirical Correlation for predicting Chemical Shifts Shoolery’s Rule (old text book) Ex) To the value from Table 14.1, add 0.3 ppm if CH2 0.7 ppm if CH 2-5 ppm according to concentration (actual value= 2.3 ppm) O-CH3 = 3.3 ppm, 3.3 + 0.3 (due to CH2) = 3.6 ppm (actual value= 3.5 ppm) C-CH3 = 0.9 ppm, 0.9 + 0.3 ( CH2) + 0.3 (CH3) = 1.5 ppm (actual value= 1.5 ppm) 0.9 ppm (C-CH3 )
Geminal coupling = Two-Bond Coupling If they are diastereotopic, then have differentchemical shifts 14.4Spin Coupling (H,H Coupling) Vicinal coupling = Three-Bond Coupling Very thoroughly studied, both experimentally and theoretically Long-range Coupling: very small (not easily detected)
spin coupling: change in the local magnetic field by nearbyH atoms having different d multiplicity: Bo BH; 559 & Figure 14.6~7 splitting pattern: Jax in 0~20 Hz (typical 6);s (singlet), d (doublet), t (triplet), q (quartet), m (multiplet), br (broad) Differing spin relationships between HA and HB
The origin of spin-spin spliting in proton A’s NMR spectrum NMRspectrum of this compound
Spin-spin splitting in ethyl iodide (CH3CH2I) Splitting pattern of methyl hydrogens Splitting pattern of ethyl hydrogens
Spin-spin splitting rule: n+1 rule Two neighboring give triplet (three peaks) n+1=3 One neighboring give douplet two peaks n+1=2 Pascal’s triangle Peak number and area (height)
The Coupling Constant (J) In 1H-NMR, peak area indicates the number of hydrogen for the corresponding absorption See 559 Fig. 14.6~7
14.5Complex Coupling Leaning The downfield peak of the triplet is slightly larger than the upfield peak. The quartet leans toward the triplet As the difference in chemical shift becomes smaller, the leaning effect becomes larger. 562 Figure 14.8 vs 569 Figure 14.10
NMR spectrum at RT one peak NMR spectrum at low temp two peaks 14.6Chemical Exchange No coupling in NMR spectrum of methanol (no splitting) unless the methanol is extremely pure In general, H in oxygen or nitrogen are subject to the rapid exchange and do not couple to nearby H’s SLOW CAMERA EFFECT
Solvent for NMR no signal not to interfere the spectrum of the sample CCl4 can be used poor solubility • Deuterated solvents (CDCl3, (CD3)2SO, C6D6) are used in NMR • Deuterium is invisible in NMR 1H-NMR measures E + small chemical shift • E (E difference between the two states) = hBo/2 • (magnetogyric ratio) of the nucleus of deuterium is different from that of hydrogen it does not appear in 1H-NMR carbocations by NMR: 565 Focus On 14.7Deuterium
Step 1. Examine the general position of the peak. Step 2. Examine the integral for the ratios of the different kinds of hydrogen. Step 3. Examine the coupling pattern. Step 4. Construct a tentative structure Step 5. Determine whether all the information is consistent with this structure 14.8Interpretation of 1H-NMR Spectra
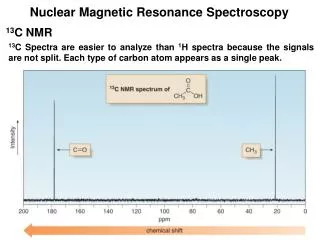
14.913C-NMR Spectrum • Chemical shift range: 0~240 ppm • Broader than that of 1N-NMR • resolution is much higher There is no, if any, 13C -13Ccoupling natural abundance: 13C 1.1% & 12C 98.9% There is 13C –1Hcoupling, while this is removed by broad band decoupling technique Then in 13C-NMR, all peaks are singlet
Other 13C-NMR Techniques Off-resonance decoupling which allows hydrogens and carbons that are directly bonded to couple CH3:quartet, CH2:triplet, CH:doublet, C:singlet Old technique DEPT-NMR: Three spectra are obtained: New technique Broad band decoupled spectrum DEPT 90o spectrum: only CH’s appear DEPT 135o: CH’s and CH3’s appear as positive absorptions and CH2’s appears as negative absorptions see next page