Download
1 / 124
1.25k likes | 1.4k Views
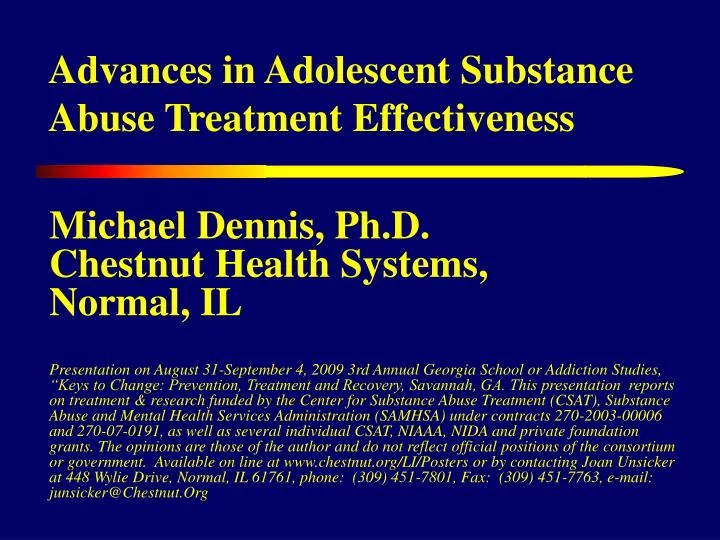
Advances in Adolescent Substance Abuse Treatment Effectiveness. Michael Dennis, Ph.D. Chestnut Health Systems, Normal, IL

E N D
Advances in Adolescent Substance Abuse Treatment Effectiveness Michael Dennis, Ph.D. Chestnut Health Systems, Normal, IL Presentation on August 31-September 4, 2009 3rd Annual Georgia School or Addiction Studies, “Keys to Change: Prevention, Treatment and Recovery, Savannah, GA. This presentation reports on treatment & research funded by the Center for Substance Abuse Treatment (CSAT), Substance Abuse and Mental Health Services Administration (SAMHSA) under contracts 270-2003-00006 and 270-07-0191, as well as several individual CSAT, NIAAA, NIDA and private foundation grants. The opinions are those of the author and do not reflect official positions of the consortium or government. Available on line at www.chestnut.org/LI/Posters or by contacting Joan Unsicker at 448 Wylie Drive, Normal, IL 61761, phone: (309) 451-7801, Fax: (309) 451-7763, e-mail: junsicker@Chestnut.Org
Goals of this Presentation are to • Examine the prevalence, course, and consequences of adolescent substance use, co-occurring disorders and the unmet need for treatment overall • Summarize major trends in the adolescent treatment system and Georgia • Highlight what it takes to move the field towards evidenced-based practice related to assessment, treatment, program evaluation and planning • Present the findings from several recent treatment studies on substance abuse treatment research, trauma and violence/crime
Part 1. Prevalence, course, and consequences of adolescent substance use, co-occurring disorders and the unmet need for treatment overall
Severity of Past Year Substance Use/Disorders(2002 U.S. Household Population age 12+= 235,143,246) Dependence 5% Abuse 4% No Alcohol or Regular AOD Drug Use 32% Use 8% Any Infrequent Drug Use 4% Light Alcohol Use Only 47% Source: 2002 NSDUH
Over 90% of use and problems start between the ages of 12-20 It takes decades before most recover or die Problems Vary by Age NSDUH Age Groups 100 People with drug dependence die an average of 22.5 years sooner than those without a diagnosis 90 80 70 60 Severity Category 50 No Alcohol or Drug Use Light Alcohol Use Only 40 Any Infrequent Drug Use 30 Regular AOD Use 20 Abuse 10 Dependence 0 65+ 12-13 14-15 16-17 18-20 21-29 30-34 35-49 50-64 Source: 2002 NSDUH and Dennis et al forthcoming
Substance use severity is related to crime and violence Crime & Violence by Substance Severity Adolescents 12-17 Source: NSDUH 2006
..as well as family, school and mental health problems Family, Vocational & MH by Substance Severity Adolescents 12-17 Source: NSDUH 2006
Brain Activity on PET Scan After Using Cocaine Rapid rise in brain activity after taking cocaine Actually ends up lower than they started Photo courtesy of Nora Volkow, Ph.D. Mapping cocaine binding sites in human and baboon brain in vivo. Fowler JS, Volkow ND, Wolf AP, Dewey SL, Schlyer DJ, Macgregor RIR, Hitzemann R, Logan J, Bendreim B, Gatley ST. et al. Synapse 1989;4(4):371-377.
Prolonged Substance Use Injures The Brain: Healing Takes Time Normal levels of brain activity in PET scans show up in yellow to red Normal Reduced brain activity after regular use can be seen even after 10 days of abstinence 10 days of abstinence After 100 days of abstinence, we can see brain activity “starting” to recover 100 days of abstinence Source: Volkow ND, Hitzemann R, Wang C-I, Fowler IS, Wolf AP, Dewey SL. Long-term frontal brain metabolic changes in cocaine abusers. Synapse 11:184-190, 1992; Volkow ND, Fowler JS, Wang G-J, Hitzemann R, Logan J, Schlyer D, Dewey 5, Wolf AP. Decreased dopamine D2 receptor availability is associated with reduced frontal metabolism in cocaine abusers. Synapse 14:169-177, 1993.
Image courtesy of Dr. GA Ricaurte, Johns Hopkins University School of Medicine
pain Adolescent Brain Development Occurs from the Inside to Out and from Back to Front Photo courtesy of the NIDA Web site. From A Slide Teaching Packet: The Brain and the Actions of Cocaine, Opiates, and Marijuana.
People Entering Publicly Funded Treatment Generally Use For Decades It takes 27 years before half reach 1 or more years of abstinence or die 100% 90% 80% 70% 60% 50% 40% 30% 20% 10% 0% Percent still using Years from first use to 1+ years of abstinence 0 5 10 15 20 25 30 Source: Dennis et al., 2005
The Younger They Start, The Longer They Use 100% 90% 80% 70% 60% 50% 40% 30% 20% 10% 0% Percent still using Age of First Use* Years from first use to 1+ years of abstinence under 15 60% longer 15-20 21+ 0 5 10 15 20 25 30 * p<.05 Source: Dennis et al., 2005
The Sooner They Get The Treatment, The Quicker They Get To Abstinence 100% 90% 80% 70% 60% 50% 40% 30% 20% 10% 0% Years to first Treatment Admission* Percent still using 20 or more years Years from first use to 1+ years of abstinence 57% quicker 10 to 19 years 0 to 9 years 0 5 10 15 20 25 30 • p<.05 Source: Dennis et al., 2005
After Initial Treatment… • Relapse is common, particularly for those who: • Are Younger • Have already been to treatment multiple times • Have more mental health issues or pain • It takes an average of 3 to 4 treatment admissions over 9 years before half reach a year of abstinence • Yet over 2/3rds do eventually abstain • Treatment predicts who starts abstinence • Self help engagement predicts who stays abstinent Source: Dennis et al., 2005, Scott et al 2005
Few Get Treatment: 1 in 17 adolescents, 1 in 22 young adults, 1 in 12 adults Substance Use Disorders are Common,But Treatment Participation Rates Are Low Over 88% of adolescent and young adult treatment and over 50% of adult treatment is publicly funded Much of the private funding is limited to 30 days or less and authorized day by day or week by week Source: OAS, 2006 – 2003, 2004, and 2005 NSDUH
Key Implications • Adolescence is the peak period of risk for and actual on-set of substance use disorders • Adolescent substance use can have short and long terms costs to society • There are real and often lasting consequence of adolescent substance use on brain functioning and brain development • Earlier Intervention during adolescence and young adult hood can reduce the duration of addiction careers • Multiple episodes of treatment are the norm • Less than 1 in 17 adolescents with abuse/dependence are getting treated
Part 2a. Trends in the Adolescent Substance Abuse Treatment System in the United States (US)
Trends in Adolescent (Age 12-17) Treatment Admissions in the U.S.: 1992-2006 15% drop off from 160,750 in 2002 to 136,660 in 2006 69% increase from 95,017 in 1992 to 160,750 in 2002 Source: Office of Applied Studies 1992- 2006 Treatment Episode Data Set (TEDS) http://www.samhsa.gov/oas/dasis.htm
2002 Median Length of Stay is only 50 days Median Length of Stay Total 50 days (61,153 discharges) Less than 25% stay the 90 days or longer time recommended by NIDA Researchers LTR 49 days (5,476 discharges) STR 21 days (5,152 discharges) Level of Care Detox 3 days (3,185 discharges) IOP 46 days (10,292 discharges) Outpatient 59 days (37,048 discharges) 0 30 60 90 Source: Data received through August 4, 2004 from 23 States (CA, CO, GA, HI, IA, IL, KS, MA, MD, ME, MI, MN, MO, MT, NE, NJ, OH, OK, RI, SC, TX, UT, WY) as reported in Office of Applied Studies (OAS; 2005). Treatment Episode Data Set (TEDS): 2002. Discharges from Substance Abuse Treatment Services, DASIS Series: S-25, DHHS Publication No. (SMA) 04-3967, Rockville, MD: Substance Abuse and Mental Health Services Administration. Retrieved from http://wwwdasis.samhsa.gov/teds02/2002_teds_rpt_d.pdf .
Despite being widely recommended, only 10% step down after intensive treatment 53% Have Unfavorable Discharges Source: Data received through August 4, 2004 from 23 States (CA, CO, GA, HI, IA, IL, KS, MA, MD, ME, MI, MN, MO, MT, NE, NJ, OH, OK, RI, SC, TX, UT, WY) as reported in Office of Applied Studies (OAS; 2005). Treatment Episode Data Set (TEDS): 2002. Discharges from Substance Abuse Treatment Services, DASIS Series: S-25, DHHS Publication No. (SMA) 04-3967, Rockville, MD: Substance Abuse and Mental Health Services Administration. Retrieved from http://wwwdasis.samhsa.gov/teds02/2002_teds_rpt_d.pdf .
Programs often LACK Standardized Assessment for… • Substance use disorders (e.g., abuse, dependence, withdrawal), readiness for change, relapse potential and recovery environment • Common mental health disorders (e.g., conduct, attention deficit-hyperactivity, depression, anxiety, trauma, self-mutilation and suicidality) • Crime and violence (e.g., inter-personal violence, drug related crime, property crime, violent crime) • HIV risk behaviors (needle use, sexual risk, victimization) • Child maltreatment (physical, sexual, emotional) • Recovery environment and peer risk
No or Inconsistent Use of Placement Criteria (even with ASAM) • difficulty synthesizing multiple pieces of information • inconsistencies between competing rules • the lack of the full continuum of care or specific services to refer people to • having to negotiate with the participant, families and funders over what they will do or pay for • there is virtually no actual data on the expected outcomes by level of care to inform decision making related to placement • In practice, programs primarily refer people to the limited range of services they have readily available. • Knowing nothing about the person other than what door they walked through we can correctly predict 75% (kappa=.51) of the adolescent level of care placements
Other Challenges in Substance Abuse Treatment Workforce and Organizations • High turnover workforce with variable educationbackground related to diagnosis, placement and treatment planning. • Heterogeneous needs and severitycharacterized by multiple problems, chronic relapse, and multiple episodes of care • Lack of access to or use of data at the program levelto guide immediate clinical decisions, billing and program planning • Missing or misrepresented datathat needs to be minimized and incorporated into interpretations
Summary of Problems in the US Treatment System • Less than 26% of Adolescents in US stay the 3 months recommended by NIDA researchers • Less than half have positive discharges • After intensive treatment, less than 10% step down to outpatient care • Problems are often assessed in an unstandardized way that leads to under identification • Structural issues related to high turnover, complicated client needs, lack of data to inform clinical decision making and issues with missing or misrepresented data
Part 2b. Trends in the Adolescent Substance Abuse Treatment System in Georgia (GA)
Past Year Alcohol or Drug Abuse or Dependence Adolescents (12-17) 7.3% GA vs. 9.8% National Source: OAS, 2006 – 2003, 2004, and 2005 NSDUH
1 3 2 State Planning Regions 4 5 Georgia Population and Regions • 8 million people in 57,906 square miles (141 people per square mile or ppsm) • Ranges for over 1000 some areas to less than 15 ppsm in some rural areas • 7% age 12-17, • 13 % age 18-25, • 62% age 26+ • 10% speak language other than English at home • Mix of Urban, Small Urban & Rural Systems Source: U.S. Census 2000 and OAS, 2006 – 2003, 2004, and 2005 NSDUH
Adolescent Substance Use Disorder & Treatment Participation Rates by Georgia State Planning Districts Below National Average on Abuse/ Dependence But also below in treatment
Substance Use Disorder & Treatment Participation Rates by Age in Georgia 1 in 179 Young Adults 1 in 36 Adolescents 1 in 10 Adults
386% growth since 1998 Systems has had two major contractions Change in Adolescent Admissions by Level of Care in Georgia Public Treatment 1992-2005 IOP and OP have grown the most, Detox the least Source: OAS, 2007 – 1992-2005 TEDS Data
Change in Adolescent Referral Source in Georgia Public Treatment 1992-2005 Juvenile Justice is the largest source of referral Source: OAS, 2007 – 1992-2005 TEDS Data
Change in Adolescent Prior Tx Admissions in Georgia Public Treatment 1992-2005 1 in 5 Adolescents have been in treatment before Source: OAS, 2007 – 1992-2005 TEDS Data
But rapid growth in Methampethamine, Opioids and Psychotropic's Change in Adolescent Focal Problems in Georgia Public Treatment 1992-2005 Primarily Marijuana and Alcohol Source: OAS, 2007 – 1992-2005 TEDS Data
Adolescent 2006 Length of Stay US vs. Georgia Median: 75 v. 115 days 90+ Days: 41 vs. 52%
Successful Discharge 56% vs. 44% Adolescent 2006 Discharge Status US vs. Georgia Transferred 14% vs. 11%
Summary of Problems in the GA Treatment System • Less than 1 in 36 adolescents with abuse/dependence in Georgia are getting treated • The public systems is changing size, referral source, and focus • Marijuana and Alcohol are the most common drugs, but meth, opioids and pscyhotropics are growing fast • Other problems are often assessed in an unstandardized way that leads to under identification • About 48% of Adolescents in Georgia stay the 3 months recommended by NIDA researchers • About 56% have negative discharges • After intensive treatment, only about 11% step down to outpatient care
Part 3a. Highlight what it takes to move the field towards evidenced-based practice related to assessment, treatment, program evaluation and planning
So what does it mean to move the field towards Evidence Based Practice (EBP)? • Introducing explicit intervention protocols that are • Targeted at specific problems/subgroups and outcomes • Having explicit quality assurance procedures to cause adherence at the individual level and implementation at the program level • Having the ability to evaluate performance and outcomes • For the same program over time, • Relative to other interventions • Introducing reliable and valid assessment that can be used • At the individual level to immediately guide clinical judgments about diagnosis/severity, placement, treatment planning, and the response to treatment • At the program level to drive program evaluation, needs assessment, performance monitoring and long term program planning
Major Predictors of Bigger Effects • Chose a strong intervention protocol based on prior evidence • Used quality assurance to ensure protocol adherence and project implementation • Used proactive case supervision of individual • Used triage to focus on the highest severity subgroup
Impact of the numbers of Favorable features on Recidivism (509 JJ studies) Average Practice Source: Adapted from Lipsey, 1997, 2005
Cognitive Behavioral Therapy (CBT) Interventions that Typically do Better than Usual Practice in Reducing Recidivism (29% vs. 40%) • Adolescent Community Reinforcement Approach (ACRA) • Aggression Replacement Training • Assertive Continuing Care • Brief Strategic Family Therapy (BSFT) • Interpersonal Social Problem Solving • Functional Family Therapy (FFT) • MET/CBT combinations and Other manualized CBT • Moral Reconation Therapy • Multidimensional Family Therapy (MDFT) • Multisystemic Therapy (MST) • Reasoning & Rehabilitation • Thinking for a Change NOTE: There is generally little or no differences in mean effect size between these brand names Source: Adapted from Lipsey et al 2001, Waldron et al, 2001, Dennis et al, 2004
Other Protocols Targeted at Specific Issues: • Detoxification services and medication, particularly related to opioid and methamphetamine use • Tobacco cessation • Adolescent psychiatric services related to depression, anxiety, ADHD, and conduct disorder • Trauma, suicide ideation, & parasuicidal behavior • Need for child maltreatment interventions (not just reporting protocols) • HIV Intervention to reduce high risk pattern of sexual behavior • Anger Management • Problems with family, school, work, and probation • Recovery coaches, recovery schools, recovery housing and other adolescent oriented self help groups / services
Impact of State Wide Screening in Washington Statewith the 2 page GAIN Short Screener Problems could be easily identified Comorbidity is common High (2+) Source: Lucenko et al (2009). Report to the Legislature: Co-Occurring Disorders Among DSHS Clients. Olympia, WA: Department of Social and Health Services. Retrieved from http://publications.rda.dshs.wa.gov/1392/
Validation of Hi Co-occurring from GAIN Short Screener to Clinical Records by Setting 2 page screener relatively consistent with other clinical indicators Source: Lucenko et al (2009). Report to the Legislature: Co-Occurring Disorders Among DSHS Clients. Olympia, WA: Department of Social and Health Services. Retrieved from http://publications.rda.dshs.wa.gov/1392/
On-site proactive urine testing can be used to reduce false negatives by more than half Reduction in false negative reports at no additional cost Effects grow when protocol is repeated
Implementation is Essential (Reduction in Recidivism from .50 Control Group Rate) The best is to have a strong program implemented well The effect of a well implemented weak program is as big as a strong program implemented poorly Thus one should optimally pick the strongest intervention that one can implement well Source: Adapted from Lipsey, 1997, 2005
Implications of Implementation Science • Can identify complex and simple protocols that improve outcomes • Interventions have to be reliably delivered in order to achieve reliable outcomes • Simple targeted protocols can make a big difference • Need for reliable assessment of need, implementation, and outcomes
Key Issues that we try to address with the Global Appraisal of Individual Needs (GAIN) • High turnover workforce with variable educationbackground related to diagnosis, placement and treatment planning. • Heterogeneous needs and severitycharacterized by multiple problems, chronic relapse, and multiple episodes of care • Lack of access to or use of data at the program levelto guide immediate clinical decisions, billing and program planning • Missing or misrepresented datathat needs to be minimized and incorporated into interpretations
GAIN Logic Model Issue Instrument Feature Protocol Feature Outcome • Standardized approach to asking questions across domains • Questions spelled out and simple question format • Lay wording mapped onto expert standards for given area • Built in transition statements, prompts, and checks for inconsistent and missing information. • Responses to frequently asked questions • Multiple training resources • Formal training and certification protocols on administration, clinical interpretation, data management, project coordination, local, regional, and national “trainers” • Above focuses on consistency across populations, level of care, staff and time • On-going quality assurance and data monitoring for the reoccurrence or problems at the staff (site or item) level • Availability of technical assistance High Turnover Workforce with Variable Education Improved Reliability and Efficiency • Multiple domains • Focus on most common problems • Participant self description of characteristics, problems, needs, personal strengths and resources • Behavior recency, breadth, frequency • Utilization lifetime, recency and frequency • Dimensional measures • Interpretative cut points • Items and cut points mapped onto DSM for diagnosis, ASAM for placement, and to multiple standards and evidence- based practices for treatment planning • Computer generated scoring and reports • Treatment planning recommendations and links to evidence-based practice • Basic and advanced clinical interpretation training and certification Comprehensive Assessment Heterogeneous Needs and Severity