Torsional Oscillation Study: Global Rotation Residuals at 0.99R from SOHO/MDI and GONG
10 likes | 97 Views
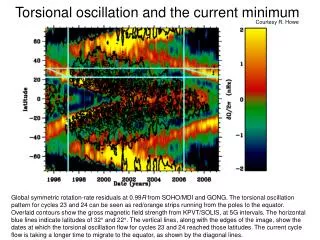
Explore the torsional oscillation pattern for solar cycles 23 and 24, visualized with magnetic field strength contours at 5G intervals. Track the flow migration to the equator and observe the current cycle's delayed progression.

Torsional Oscillation Study: Global Rotation Residuals at 0.99R from SOHO/MDI and GONG
E N D
Presentation Transcript
Torsional oscillation and the current minimum Courtesy R. Howe Global symmetric rotation-rate residuals at 0.99R from SOHO/MDI and GONG. The torsional oscillation pattern for cycles 23 and 24 can be seen as red/orange strips running from the poles to the equator. Overlaid contours show the gross magnetic field strength from KPVT/SOLIS, at 5G intervals. The horizontal blue lines indicate latitudes of 32° and 22°. The vertical lines, along with the edges of the image, show the dates at which the torsional oscillation flow for cycles 23 and 24 reached those latitudes. The current cycle flow is taking a longer time to migrate to the equator, as shown by the diagonal lines.