Active Asset Allocation Strategies Using ETFs
270 likes | 289 Views
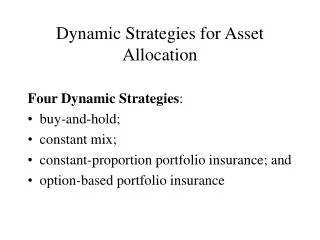
Active Asset Allocation Strategies Using ETFs. Marvin Appel, MD, PhD CEO, Appel Asset Management Corp. Great Neck, NY mappel@appelasset.com. Outline. Update relative strength strategies from my 2005 presentation to QWAFAFEW Growth vs value SPX vs EAFE—extended to include emerging markets

Active Asset Allocation Strategies Using ETFs
E N D
Presentation Transcript
Active Asset Allocation Strategies Using ETFs Marvin Appel, MD, PhD CEO, Appel Asset Management Corp. Great Neck, NY mappel@appelasset.com
Outline • Update relative strength strategies from my 2005 presentation to QWAFAFEW • Growth vs value • SPX vs EAFE—extended to include emerging markets • Covered call writing– Not all ETFs are created equal.
Concept of relative strength • Divide index1 by index2. These indexes may reflect price or total return. • Rising ratio means index1 (numerator) is stronger. • Falling ratio means index2 (denominator) is stronger. • Relative strength leadership does not tell you whether either or both indexes are showing profits or losses.
Growth versus value model • Select value and growth benchmarks for either large or small caps (eg: Russell 2000 value and growth indexes) • Calculate the monthly total return indexes and find the ratio as of the last day of each month. • Look for 10% reversals in the ratio to define new long term trends.
Trend-following strategy: large-cap value versus large-cap growth Source: Mutual Fund Expert as of 5/31/2010
History of value/growth model signals for large cap (Russell 1000) Indexes
Trend-following strategy: small-cap value versus small-cap growth Source: Mutual Fund Expert as of 5/31/2010
History of value/growth model signals for small-cap (Russell 2000) Indexes
Foreign (developed country) versus U.S. stock model • Use MSCI EAFE as the benchmark for foreign stocks and S&P 500 as the U.S. benchmark. • Calculate the ratio of EAFE / S&P 500 (price-only data) on the last day of each month. • A new trend is defined by a 15% reversal in relative strength.
MSCI U.S. versus EAFE Source: MSCI Barra (http://www.mscibarra.com/products/indices/international_equity_indices/gimi/stdinde)x/performance.html)
A Quarterly Asset Allocation Strategy for Foreign-Equity ETFs FT Press 2008
Three distinct areas of the world’s stock markets Source: MSCI Barra (http://www.mscibarra.com/products/indices/international_equity_indices/gimi/stdinde)x/performance.html)
Quarterly rotation among broad areas of the foreign stock market • Evaluate MSCI gross total return, US Dollar indexes at the end of each quarter for Japan, Emerging Markets and Europe • Whichever area was strongest in the prior quarter should be held in the current quarter. • Can use ETF data instead: • EWJ for Japan • EEM or VWO for emerging markets • IEV for Europe
Europe / Japan / Emerging Mkts Source: MSCI Barra (http://www.mscibarra.com/products/indices/international_equity_indices/gimi/stdinde)x/performance.html)
Covered call writing • In return for a fixed payment up front, you agree to forego profits but bear losses that may occur within a limited period of time on a stock or ETF. • Example: I will accept 1.2% to forego all profits and bear all losses in the S&P 500 SPDR (SPY) between now and March 19, 2010 (12 trading days). • The maximum possible gain is the 1.2% of risk capital • Losses can be as large as the amount by which the S&P 500 SPDR (SPY) can fall between now and March 19. • But any loss will be mitigated by the 1.2% I collected. (So if the market falls 5%, my loss on the covered call position will be 3.8%.) • Not a “conservative” strategy • Good strategy for flat or slowly rising markets, like the second year of bull markets. • Important to choose the right ETFs or stocks • It has been possible historically to achieve a significant risk reduction without loss of profitability • Need to watch transaction costs
Covered call position • Buy 100 shares of stock and sell one option on the stock. • Gain is likely to occur, but is limited. • Losses are relatively unlimited, but in a losing month writing a covered call always reduces losses compared to owning the shares alone.
Covered call writing: S&P 500 Sources: www.cboe.com, Investors FastTrack
Covered call writing: Dow Jones Industrial Average Sources: www.cboe.com, Investors FastTrack
Covered call writing: NDX Sources: www.cboe.com, Investors FastTrack
Covered call writing: Russell 2000 Sources: www.cboe.com, Investors FastTrack
Shorter-term ETF relative strength rankings and trading strategies are reported in my newsletter, Systems and Forecasts (www.systemsandforecasts.com)