Download
1 / 18
180 likes | 300 Views
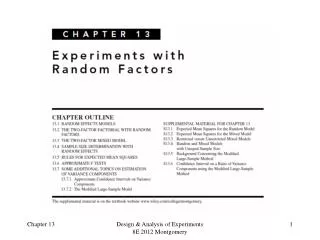
Examples of Designed Experiments With Nonnormal Responses. SHARON L. LEWIS, DOUGLAS C. MONTGOMERY and RAYMOND H. MYERS Journal of Quality Technology , 33, pp. 265-278, 2001 演講者 : 張秉鈞. Outline. Introduction Example 1: The Drill Experiment

E N D
Examples of Designed Experiments With Nonnormal Responses SHARON L. LEWIS, DOUGLAS C. MONTGOMERY and RAYMOND H. MYERS Journal of Quality Technology, 33, pp. 265-278, 2001 演講者: 張秉鈞
Outline • Introduction • Example 1: The Drill Experiment • Example 2: The Windshield Molding Slugging Experiment • Conclusion
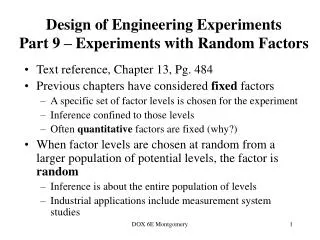
Introduction • In general, linear model : • Check model’s three basic assumption 1. Normal probability plot 2. Residuals plot • Nonnormal responses 1. data transformations 2. GLM (Generalized Linear Models)
Generalized Linear Models • Three components: (1) Response distribution is exponential family (Binomial, Poisson, Gamma, Normal, etc) (2) Linear predictor (3) Link function (relationship between the and )
More details: Introduction to Linear Regression Analysis (Chapter 13) • Software packages: SAS, S-PLUS • Objective: To compare two approaches by designed experiments with nonnormal responses • Criterion: Lengths of confidence intervals of mean response
The Drill Experiment • unreplicated factorial design • advance rate drill load flow rate rotational speed type of drilling mud used • GLM: Gamma distribution, log link function
Half -Normal Probability Plot , and are significant effects data transformation model: GLM model:
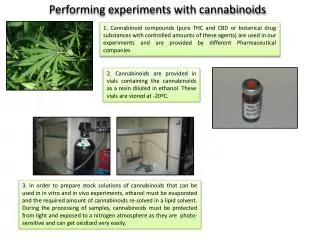
The Windshield Molding Slugging Experiment • During the stamping process, debris carried into the die appears as slugs in the product • fractional factorial design, and resolution III • number of good parts out of 1000 poly-film thickness (0.0025, 0.00175) oil mixture (1:20, 1:10) gloves (cotton, nylon) metal blanks (dry underside, oily underside)
Design Matrix and Response Data • data transformation: logistic • GLM: Binomial distribution, logistic link function
Refit the Model (GLM) • We fit the model with factors
Conclusion • Data transformations may be inappropriate for some situations • With the GLM, normality and constant variance are not required • With the GLM, length of confidence interval is short
References • HAMADA, M. and NELDER, J. A. (1997). “Generalized Linear Models for Quality-Improvement Experiments”. Journal ofQuality Technology29, pp. 292-304 • MONTGOMERY, D. C. (2001). Design and Analysis ofExperiments, 5th ed. John Wiley & Sons, Inc., New York, NY • MONTGOMERY, D. C. and PECK, E. A. (1992). Introduction to Linear Regression Analysis, 2th ed. John Wiley & Sons, Inc., New York, NY • MYERS, R. H. and MONTGOMERY, D. C. (1997). “A Tutorial on Generalized Linear Models”. Journal ofQuality Technology29, pp. 274-291