Download
1 / 63
630 likes | 726 Views
Taking Stock Of the South East. www.takingstock.org. Summary. South East background Results of Materials Flow Analysis and Ecological Footprint studies Sector details Policy Context / Trends Lifestyles / Future scenarios Case Studies. Project Partners. EcoSys Project Management

E N D
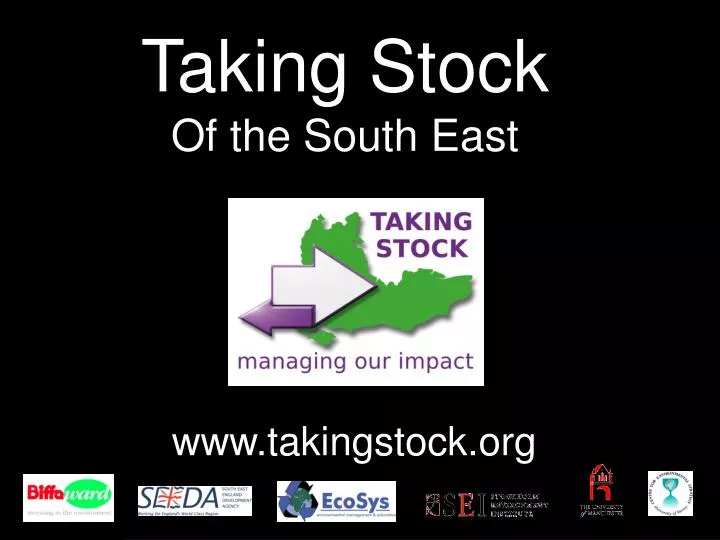
Taking Stock Of the South East www.takingstock.org
Summary • South East background • Results of Materials Flow Analysis and Ecological Footprint studies • Sector details • Policy Context / Trends • Lifestyles / Future scenarios • Case Studies
Project Partners • EcoSys Project Management Dissemination • SEI-York Mass Balance Eco-Footprint • CURE, Manchester Scenarios Integrated Model • CES, Surrey Local Data, LCA, Embodied Energy • Biffaward & SEEDA Funders
South East Statistics • Population 8.1 million in about 3 million households • 4 million people employed, 80% in service industries • 373,600 business sites • 600,000 people of working age with no qualifications • Receives 25% of all UK expenditure in R&D • Has over 700 Sites if Special Scientific Interest (SSSIs) • Contains a third of England’s ancient woodland • Fastest growing economy in the UK
SE Prosperity and Consumption • High level of consumption – mainly due to economic prosperity. • SE residents: • Travel further than residents of any other region • Have more holidays • Produce more waste • Purchase more consumer items • Highest demand for housing • Serious transport problems and worst congestion outside London. • Lowest level of public investment per head of any English region.
SE Trends • These negative impacts set to continue • New housing developments to accommodate forecast growth • Overheated economy while areas of severe social and economic deprivation • Waste increasing in line with wealth • Water scarce resource • High dependence on fossil fuels – insufficient renewable energy sources • Land availability is crucial constraint • Climate change leading to increased risk of flooding • Increasing pollution and exploitation of resources
SE Materials Consumption Direct Material Consumption in 2000 was 88 milliontonnes or 11 tonnes per person. Total Material Consumption, including indirect or “hidden” resources involved in producing the materials we directly consume is 211 million tonnes or 26 tonnes per person
Definition of an Ecological Footprint 1 “The land area required by the people in a defined region to provide all the resources and services they presently consume and to absorb all the waste they presently discharge wherever that land might be.” Energy land Bio-productive sea Bio-productive land Habitat land Built land
Definition of an Ecological Footprint 2 The Ecological Footprint accounts for the use of or the impact on the planet’s renewable resources. It is a ‘snapshot’ based on data from a single year. Together with information on available biocapacity it can inform us about the sustainability of our lifestyles and consumption. It is measured in global hectares (gha) and usually expressed in gha per person.
So What Constitutes an Ecological Footprint? A cooked meal of fish and chips requires bioproductive land for the potatoes, bioproductive sea for the fish, and forested 'energy' land to re-absorb the carbon emitted during the processing and cooking. Driving a car requires built land for roads, parking etc, as well as a large amount of forested 'energy' land to re-absorb the carbon emissions from petrol use. In addition, energy and materials are used for construction and maintenance.
Ecological Footprint by Region (1996) 12 10 8 area units per person 6 North America 4 Western Europe Central & Eastern Europe 2 Middle East & Central Asia Latin America & Caribbean Asia - Pacific Africa - 0 1,000 2,000 3,000 4,000 5,000 6,000 Source: WWF
Taking Stock - Ecological Footprint of SE residents • The Ecological Footprint of South East residents in 2000 was 55 million global hectares (gha). • Equivalent to 6.8 gha per person (world average 1.9 gha per person). • Total eco-footprint is 29 times the physical land area of the region • equivalent to the size of France • If all the world’s population lived like us….
We’d Need 3 ½ Planets This means someone else somewhere else is paying the price…
UK Eco-Footprint Comparisons The South East region footprint is calculated at 6.8 global hectares per person. Bigger than Wales at 5.25 global hectares per person Bigger than London at 6.63 global hectares per person
Methodology Energy carriers (fuels) Embodied energies CO2 Material flows(regional consumption) Yield factors Hidden flows Ecological footprint Total Material Consumption Direct Material Consumption
CO2 Production Due to material consumption in the South East we produced 158 million tonnes of CO2 in 2000, equivalent to 19.5 tonnes per person. This is 3 times the amount emitted within the region.
Sector Details • Food • Transport • Construction • Energy and Water • Household Consumption • Waste Factsheets on each sector are downloadable from www.takingstock.org
Food & Drink 1 • The EF of food and drink consumption was 13.7 million global hectares – 1.7 gha per person = ¼ total footprint from all activities. • 5 million tonnes of food were consumed in SE households in 2000 – about 620kg per person. • Packaging used for this weighed 660,000 tonnes or 81kg per person. • Over 1 million tonnes of food and drink per year, or 124kg per person, goes directly to waste. This includes around 43% of food supplied for catering and 14% of household food and 88% of it ends up in landfill sites.
Food & Drink 2 Main Data Sources: National Food Survey, National Trade Statistics
Transport 1 • Accounted for EF of 11.4 million global hectares – 1.4 gha per person, a fifth of the total EF. • Average SE resident travelled 20,700 kms in 2000, 54% by car and 37% by air. • The average distance travelled on surface transport was 13,100 km per person, or 36km per day per person. 85% of this was by car, 6% by rail and 3% by bus. • By air the average was 7,600km per person, of which 97% was international travel, and 26% of this was within the EU. • Walking averaged 304km per person, and cycling 74km, or one mile per week per person.
Transport 2 Main Data Sources: National Transport Statistics (e.g. National Travel Survey, Focus on Personal Travel, Focus on Freight, …)
Construction 1 • EF of construction was 9.5 million global hectares – 5 times larger than the land area of the region – 1.2 gha per person and 17% of the total EF from all activity. • Construction used 50.5 million tonnes of materials directly (DMC), which is 57% of the regional total, and this involved 100 million tonnes in total material consumption (TMC). This equates to over 12 tonnes for every person in the SE region. • Construction activity produced 23% of the total CO2 emissions.
Construction 2 Main Data Sources: Aggregate Minerals Survey for England and Wales, UK Construction Industry Mass Balance (based on PRODCOM)
Commercial & Public Services 1 • The EF of commercial and public services was 9.5 million gha, equivalent to almost 1.2 gha / person or 17% of the total. • Total material consumption was 26 million tonnes, around 12% of the total. • These services are responsible for 11% of total CO2 emissions in the region.
Commercial & Public Services 2 Data Sources: Economic Input-Output Tables, PRODCOM, commercial waste statistics
Energy and Water 1 • The total energy consumed in South East households in 2000 was 75,000 million kWh, or 9,000 kWh per person, 3/4 of which was gas. • This energy supply produced over 2 tonnes of CO2 per year per person. • Over half of the energy consumed in homes was for space heating, 18 % was for cooking, lighting and appliances, and most of the remaining 24% was for heating water. • The total EF of household energy and water supply is 4.8 million global hectares, or 0.6 gha per person = about 9% of the total footprint per person. • Commercial energy & water accounted for a further 2.1 million gha, making a combined total of 0.85 gha / person, around 12.5% of the total.
Energy and Water 2 • Household water consumption is around 60,000 litres per person per year, or 165 litres per person per day. About 1/3 of this is used for flushing toilets. • The energy used in the South East water supply system is 860 million units (kWh). • Supply to households, and the drainage / sewage system, are each about 40% of the total. Most of the rest goes in leakages. The EF of the water supply system is about a sixth of 1% of the total EF per person. • Nationally, about half of all water use is for cooling power stations. Public water supply for households and for services accounts for 30 per cent of consumption.
Energy and Water 3 Data Sources: Household Expenditure Survey, Digest of UK Energy Statistics, DEFRA Environmental Statistics
Household Consumption 1 • Durable goods (eg car, furniture, white goods) -grand total of direct materials consumed is 1 million tonnes including: • Cars 500,000 tonnes • Furniture 400,000 tonnes • Consumable goods - direct materials consumed was 1.75 million tonnes: • Dominated by paper based items - over 45% • Petfood - 22% (high EF also due to meat content) • Food residues and waste - 13% • Soaps and household chemicals - 12% • The EF from all h/hold consumption was 0.52 gha/person, or 7.5% of the total.
Household Consumption 2 Data Sources: Household Expenditure Survey(Prices from PRODCOM, cross-checked with genuine data and waste data)
Waste • Almost 37 million tonnes of waste was produced in the South East. • Over 80% of household waste was landfilled with • Around 18% recycled or composted • The EF for h/hold waste management was 4.5m gha, or 8% of the total. Disposing of paper/card accounts for over 50% of this.
What can we do about it? • Choices and Priorities - Policy Context / Trends • Lifestyles - Future Scenarios • Factor Four • Case studies
Choices and Priorities What kind of future can we invent? • Hopes, aspirations • Needs, wishes, wants • Fears, distrust • Expectations, probabilities All these are drivers of consumption and the lifestyles which generate it.
Current Policy Context • No legal requirement or specific policy directive to minimise consumption or the Ecological Footprint. • Consumption and footprint issues tend to fall in gaps between policies. • Any stand-alone directive to reduce consumption unlikely to be politically viable. • Need to take lateral approach to policy influencing resource management.
Key SE Regional Strategies • Integrated Regional Framework (SEERA, 2004) • Regional Economic Strategy (SEEDA, 2002) • Framework for Employment and Skills (SEEDA,2002) • Regional Transport Strategy (SEERA, 2003) • Regional Planning Guidance (RPG) (SEERA, 2001) • Sustainable Communities (National, 2003) • Rising to the Challenge – (SECCP, 1999) • No Time to Waste - Regional Waste Management Strategy - (SEERA, 2003) • Regional Strategy for Energy Efficiency and Renewable Energy (SEERA, 2003)
Integrated Regional Framework for the South East Key issues and needs include: • Ensuring an adequate supply of affordable housing • Reducing social exclusion & poverty • Tackling the growth in car traffic and improving public transport • Using natural resources more prudently • Reducing pollution and waste • Enhancing biodiversity • Managing and mitigating impacts of climate change • Improving overall levels of health • Improving the overall quality of the environment • Adapting to the needs of an ageing population • Improving educational attainment and skill levels and achieving high employment
Regional Economic Strategy for South East England • 10 year framework to deliver economic aspirations (2002 –2012) using sustainable development principles. 5 main objectives: • Competitive businesses • Successful people • Vibrant communities • Effective infrastructure • Sustainable use of natural resources
What Kind of Scenario? • What kind of world will we be living in? (context scenarios) • What are the policy options and pressures? (policy scenarios) • What would the effect be? (footprint scenarios) • How would we start to achieve it? (resource management scenarios)
4 Scenarios 4 scenarios out of a possible infinite number: F0 – high growth – free markets F1 – business as usual – more of the same F2 – low growth – risk & disaster F4 – factor four – sustainable communities
4 Time Steps Focus on 4 time steps: • 2005 – ‘soon’ - tensions between economy, environment & society. • 2010 – ‘later’ - we see the direct effects of current decisions. • 2020 – ‘children’s world’ – a new generation will have to live with the mistakes of the present. • 2050 – ‘grandchildren’s world’ – there will be challenges which we can hardly imagine as yet.
F-0 F-1 F-2 F-4 FOOTPRINT SCENARIO Greatly increasing resource use Existing trends - 'business as usual' Doubling resource efficiency Doubling efficiency & halving resource use WORKING TITLE Big spenders Business as usual Technology to the rescue Green scene IMAGES 4x4 SUV / holiday home Suburban semi / Telegraph Urban loft / Big Issue Solar architecture / bicycle Link to UK Foresight Scenarios. World markets Management take over Risk society Sustainable communities 4 Scenarios