Download
1 / 38
380 likes | 553 Views
Asset Allocation Tweaking the Old Model. Craig L. Israelsen, Ph.D. Brigham Young University Presented at CFDD Conference October 2009 Scottsdale, Arizona www.7TwelvePortfolio.com 38 slides. Historical Asset Returns. Data. Large-cap US equity represented by the S&P 500 Index.

E N D
Asset AllocationTweaking the Old Model Craig L. Israelsen, Ph.D. Brigham Young University Presented at CFDD Conference October 2009 Scottsdale, Arizona www.7TwelvePortfolio.com 38 slides
Data • Large-cap US equity represented by the S&P 500 Index. • Small-cap US equity represented by the Ibbotson Small Companies Index from 1970-1978, and the Russell 2000 Index from 1979-2008. • Non-US equity represented by the MSCI EAFE Index. • Real estate represented by the NAREIT Index from 1970-1977 and the Dow Jones Wilshire REIT Index from 1978-2008. • Commodities represented by the Goldman Sachs Commodities Index (GSCI). As of February 6, 2007, the GSCI became the S&P GSCI Commodity Index. • U.S. intermediate term bonds represented by the Ibbotson Intermediate Term Bond Index from 1970-72 and the Lehman Brothers Intermediate Term Government Bond index from 1973-2008 (a Barclays Capital index as of late 2008). • Cash represented by 3-month Treasury Bills.
Historical Upside and Downside * Worst One-Year Loss Occurred in 2008
Performance During Accumulation Phase Individual Assets vs. Typical Portfolios vs. Multi-Asset Portfolio
What Was Different in 2008? Commodities and real estate did not help out as in prior equity downturns.Prior to 2008, the worst one-year return for the Multi-Asset Portfolio was (5.48)
Portfolio Performance during Post-Retirement Distribution Phase
$1,000,000 Starting Balance5% initial withdrawal ($50,000) 4% COLA
$1,000,000 Starting Balance10% initial withdrawal ($100,000) 4% COLA
$1,000,000 Starting Balance5% initial withdrawal ($50,000) 4% COLA
Building a Multi-Asset Low Correlation Balanced Portfolio7Twelve • 7 Core Asset Classes utilizing • 12 Underlying Funds
7TwelvePortfolio Correlation10-year Aggregate Correlation = 0.38Using annual returns from 1999-2008
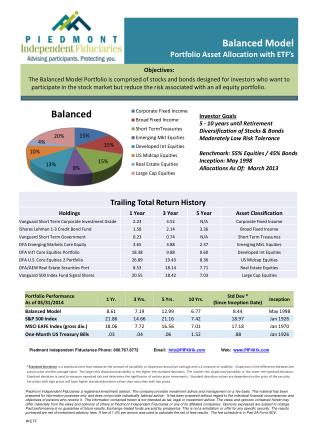
7Twelve as a Complete PortfolioA Multi-Asset Balanced Portfolio Old vs. New
7Twelve as Portfolio ComponentA Multi-Asset Balanced Portfolio
Distribution 7Twelve Portfolio$1,000,000 Initial Account Value, 5% Initial Withdrawal, 3% Annual Increase in Withdrawal
7Twelve Balanced Portfolio 1) As a balanced fund, 7Twelve is a “QDIA” (Qualified Default Investment Alternative) under the 2006 Pension Protection Act. 2) Portfolio logistics are straight-forward: • Equally-weighted, annually rebalanced. • Using cash flows to accomplish rebalance increases tax efficiency. 3) No reliance upon tactical skill or timing. 4) Represents the core “module” of any portfolio pre or post retirement. Examples: 80% 7Twelve, 20% individual stocks 60% 7Twelve, 20% TIPS, 20% cash 5) Can be built using actively managed funds, passively managed index funds, ETFs, ETNs, or CTFs (collective trust funds).
An updated PowerPoint presentation that includes year-end 2009 data is available to purchase. To order go to www.7TwelvePortfolio.com Or Contact Craig Israelsen at craig@7TwelvePortfolio.com
Craig L. Israelsen, Ph.D. Brigham Young University Email:craig@7TwelvePortfolio.com Web:www.7TwelvePortfolio.com