Slide Note
0 likes | 12 Views
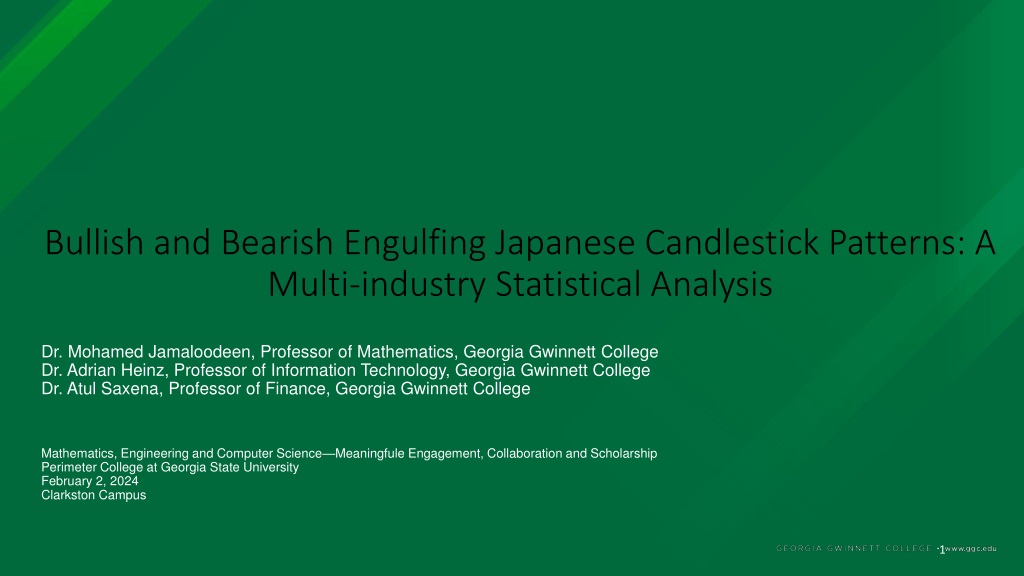
A study was conducted to analyze the effectiveness of bullish and bearish engulfing candlestick patterns in predicting price trends across six industry indices from 1998 to 2020. The study focused on quantifying trends, levels of engulfing, and success criteria based on price movements after the appearance of these patterns. Results indicated varying success rates for predicting price bottoms and tops compared to overall market trends.

E N D
Bullish and Bearish Engulfing Japanese Candlestick Patterns: A Multi-industry Statistical Analysis Dr. Mohamed Jamaloodeen, Professor of Mathematics, Georgia Gwinnett College Dr. Adrian Heinz, Professor of Information Technology, Georgia Gwinnett College Dr. Atul Saxena, Professor of Finance, Georgia Gwinnett College Mathematics, Engineering and Computer Science—Meaningfule Engagement, Collaboration and Scholarship Perimeter College at Georgia State University February 2, 2024 Clarkston Campus 1
Japanese Candlesticks • Charting methodology to plot price variations of an underlying asset such as a stock, exchange traded funds (ETFs), commodities, futures, cryptocurrencies, etc. • For a given session, each candle is drawn using the open, high, low, and close prices. • A session may consist of a month, a week, a day, an hour or even minutes.
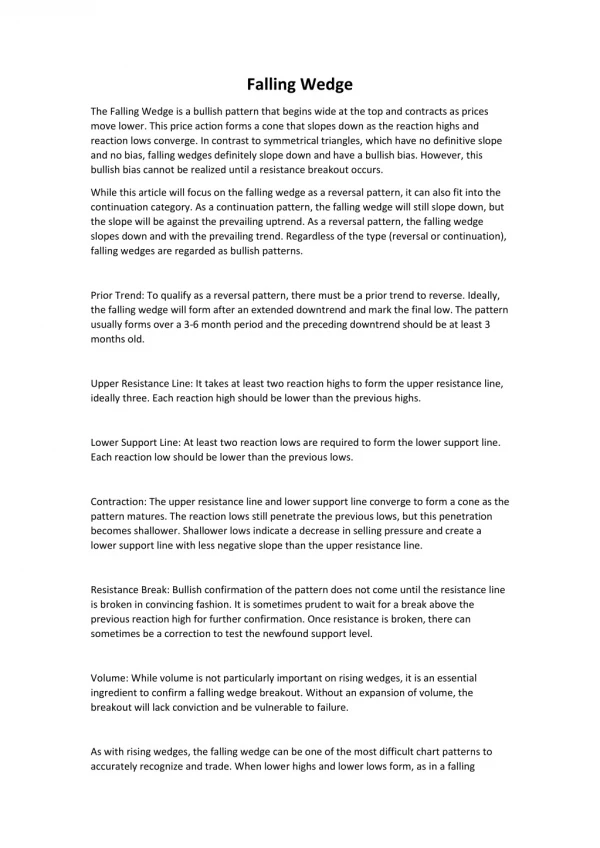
Bullish Engulfing Candle Pattern • Two-candle pattern consisting of a small red candle followed by a large green candle whose body completely covers (engulfs) the previous candle’s body • Shadows are not a consideration. • This pattern is believed to forecast an uptrend (after a downtrend)
Bearish Engulfing Candle Pattern • Two-candle pattern consisting of a small green candle followed by a large red candle, which completely covers (engulfs) the previous day candle’s body • This pattern is believed to forecast a downtrend (after an uptrend)
Study of Bullish and Bearish Engulfing Candles to Six Industry Indexes (from 1998 to 2020)
Study of Bullish and Bearish Engulfing Candles to Six Industry Indexes (from 1998 to 2020) Industry Index Securities of companies from 1. Materials Select Sector SPDR Fund (XLB) chemicals; metals and mining; paper and forest products; containers and packaging; and construction materials. oil, gas, and consumable fuels; and energy equipment and services. 2. Energy Select Sector SPDR Fund (XLE) 3. Financial Select Sector SPDR Fund (XLF) diversified financial services; insurance; banks; capital markets; mortgage real estate investment trusts ("REITs"); consumer finance; and thrifts and mortgage finance. aerospace and defense; industrial conglomerates; marine; transportation infrastructure; machinery; road and rail; air freight and logistics; commercial services and supplies; etc. hardware, storage, and peripherals; software; communications equipment; semiconductors and semiconductor equipment; IT services; and electronic equipment, instruments and components pharmaceuticals; health care equipment & supplies; health care providers & services; biotechnology; life sciences tools & services; and health care technology. 4. Industrial Select Sector SPDR Fund (XLI 5. Technology Select Sector SPDR Fund (XLK) .6. Health Care Select Sector SPDR Fund (XLV)
Example Daily Chart of select sector Technology SPDR (XLK)
Technical considerations (a)– Quantifying Trends and Engulfing •Uptrend/Downtrend • Uptrend. It occurs when the n-day moving average close price has been increasing for at least 70% of the days. • Downtrend. It occurs when the n-day moving average close price has been decreasing for at least 70% of the days. • We consider the success of patterns when both a) preceded by a trend (WT) and without a trend (RT) •What is engulfing? • This enables separate analysis of the instances on which the first candle’s body is at most 75%, then 50% and finally 25% of the size of the second candle’s body to examine whether the size of the first candle’s body is relevant to the pattern’s forecasting power.
Technical considerations (b): Three possible success criterion evaluated over variable n days (moving averages n=3, 5, 7, 10) after candle appearance Bullish Engulfing Candle Price Criteria Bearish Engulfing Candle Price Criteria o Open. No Close price is lower than the Open of the Bullish Engulfing’s second candle. o Close. No Close price is lower than the Close of the Bullish Engulfing’s second candle. o Low. No Close price is lower than the Low of the Bullish Engulfing’s second candle. o Open. No Close price is higher than the Open of the Bullish Engulfing’s second candle. o Close. No Close price is higher than the Close of the Bullish Engulfing’s second candle. o High. No Close price is higher than the High of the Bullish Engulfing’s second candle
Data Collection • C++ program to analyze 1998-2020 intraday data for 6 industry indices • Detect trends (uptrend/downtrend) • Detect candle • Quantify level of engulfing (25 %, 50 %, 75 % ) • Determine success or failure of candle • Based on 3 price criterion • Based number of days of subsequent bull or bear run (3-, 5-, 7- and 10-day moving averages)
Results I: success proportions descriptive findings • Important design consideration: • We compare the Bullish and Bearish Engulfing patterns’ success rates for predicting price bottoms and price tops, respectively against the success rate for all days, regardless of patterns, in predicting bottoms and tops (bull and bear sequences) • Another way to think of this is days without the engulfing candle correspond to other candles. • It is found that for each of the six industries, • the proportion of success for the Bearish Engulfing candle is much higher than the proportion of successes for all candles except when the CLOSE criterion is used, in which case the success proportions for the Bearish Engulfing sequence are similar, if not slightly lower than the success proportion of all candles. • The exact same situation is true when comparing the success proportions of the Bullish Engulfing sequence compared to the proportion of successes for all candles—namely the Bullish Engulfing pattern success proportions are much higher except, again, when the CLOSE criterion is used. • These are all regardless of trend (whether the pattern was preceded by a trend or not), regardless of the number of moving average days (3-, 5-, 7-, or 10 day) and also regardless of the percentage of body Engulfing (25%, 50% or 75%).
Success proportions for the Bearish Engulfing candle, by industry, versus the success proportions for all candles. Industry—eg XLB n= 10 day MA and percentage of body engulfing =75 %
Results II (success proportions inferential findings) • Non-parametric tests • chi-squared tests for independence (tops are independent of Bearish engulfing candle pattern; bottoms are independent of Bullish Engulfing pattern) • T-test for success proportions (success proportions of Bearish or Bullish Engulfing pattern are greater than success proportion without candle) • Results, in almost every scenario, except when the CLOSE criteria is used, there is strong statistical evidence to suggest that • Tops are dependent on the Bearish Engulfing candle; Bottoms are dependent on the Bullish Engulfing candle • The proportion of successful tops for the Bearish Engulfing is statistically larger than the corresponding proportion of all tops, and that the proportion of successful bottoms for the Bullish Engulfing candle is statistically larger than the corresponding proportions of all bottoms
Tests for independent and proportions (e.g.Industry XLB using Bearing Engulfing)
Other results (ANOVA on transformed success proportions) • The number of days used in the moving average is seen to be a factor for the proportion of successes • The percent of body Engulfing is not a statistically significant factor for proportion of successes • The price criterion (OPEN/CLOSE/HIGH in the case of Bearish Engulfing and OPEN/CLOSE/LOW in the case of Bullish Engulfing) is a factor for the proportion of successes • ANOVA results for the Bearish and Bullish Engulfing suggest that there is no statistically significant difference in success proportions by industries,
Conclusions • We provide and empirical basis for investors and researchers following the technical analysis brand of investing. • Potentially this study ought to create more interest in the utilization of the Japanese candlesticks technique in the financial literature. • Future research may include a statistical analysis of the historical performance of other patterns such as Bullish/Bearish Harami or Morning/Evening Star in the S&P 500 index or across the same industries used in this work