QT Evaluation Studies: Pharmacometric Considerations
420 likes | 514 Views
Explore the complexities of assessing drug effects on QT interval through clinical trial simulation and evaluation studies. Understand variability, response discrepancies, and the role of study design in decision-making.

QT Evaluation Studies: Pharmacometric Considerations
E N D
Presentation Transcript
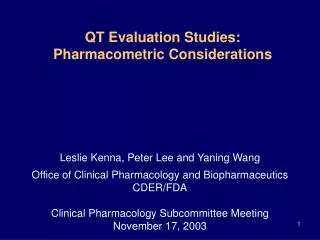
QT Evaluation Studies: Pharmacometric Considerations Leslie Kenna, Peter Lee and Yaning Wang Office of Clinical Pharmacology and Biopharmaceutics CDER/FDA Clinical Pharmacology Subcommittee Meeting November 17, 2003
Outline • Overarching question • Challenges • Methods: Clinical Trial Simulation • Preliminary results
What do we want to know? Drug effect on QT interval: “Worst-case” scenario
Challenges Variation in response > response of interest
Challenges Variation in response > response of interest • Wide intra-individual variability e.g. #1: within day variability
15 msec Historical Baseline QTc Data for Drug “X”Subject i: 10 ECGs / time QTcF (msec) Time (hr)
Challenges Variation in response > response of interest • Wide intra-individual variability e.g. #1: within day variability e.g. #2: between day variability
Smooth Day 1 Smooth Day 2 Smooth through Days 1:4 Smooth Day 3 Smooth Day 4 Intraindividual Variability in Baseline QTc: Subject i: 4 Days of Measurement QTCF (msec) Time (hr)
Challenges Variation in response > response of interest • Wide intra-individual variability e.g. #1: within day variability e.g. #2: between day variability • Wide inter-individual variability
Interindividual Variability in Baseline QTc Subject i Subject k QTCF (msec) Time (hr)
Observations in Recent Submissions Diverse study designs: e.g. duration, timing, # replicates
Observations in Recent Submissions Diverse study designs: e.g. duration, timing, # replicates Different response to same positive control • Case 1 Moxifloxacin 400 mg 8 msec DQTcF • Case 2 Moxifloxacin 400 mg 13 msec DQTcF
Observed Response to Moxifloxacin in Two Recent QT Evaluation Studies What role did study design play in the discrepancy in response?
Observations in Recent Submissions Diverse study designs: e.g. duration, timing, # replicates Different observed response to same positive control • Case 1 Moxifloxacin 400 mg 8 msec DQTcF • Case 2 Moxifloxacin 400 mg 13 msec DQTcF Observed response sensitive to analysis method • Mean vs. outlier analysis
Observations in Recent Submissions Diverse study designs: e.g. duration, timing, # replicates Different observed response to same positive control • Case 1 Moxifloxacin 400 mg 8 msec DQTcF • Case 2 Moxifloxacin 400 mg 13 msec DQTcF Observed response sensitive to analysis method • Mean vs. outlier analysis • Definition of baseline
Definition of Baseline Influences Analysis(# Outliers) “Baseline” Dose-response appears shallow
Definition of Baseline Influences Analysis(# Outliers) “Baseline” “Baseline” Response directly proportional to dose
Goal Use available data to aid in the prospective design of QT studies
Specific Aims • • Assemble a QT database from submissions • • Resample the data and use Clinical Trial Simulation to evaluate: • (a) clinical trial designs • (b) data analysis methods
Simulation Study Overview Create true data Sample from historical baseline QT data Choose models and parameters for study design, PK, PD Add baseline response to simulated response to treatment Sample true data according to study design Estimate response Metrics in Concept Paper, in submissions Repeat “many” times at given set of study design parameters Compute Performance Power: Fraction of simulations yielding insignificant effect
Simulation Study Overview Create true data Sample from historical baseline QT data Choose models and parameters for study design, PK, PD Add baseline response to simulated response to treatment Sample true data according to study design Estimate response Metrics in Concept Paper, in submissions Repeat “many” times at given set of study design parameters Compute Performance Power: Fraction of simulations yielding insignificant effect
Simulation Study Overview Create true data Sample from historical baseline QT data Choose models and parameters for study design, PK, PD Add baseline response to simulated response to treatment Sample true data according to study design Estimate response Metrics in Concept Paper, in submissions Repeat “many” times at given set of study design parameters Compute Performance Power: Fraction of simulations yielding insignificant effect
Simulation Study Overview Create true data Sample from historical baseline QT data Choose models and parameters for study design, PK, PD Add baseline response to simulated response to treatment Sample true data according to study design Estimate response Metrics in Concept Paper, in submissions Repeat “many” times at given set of study design parameters Compute Performance Power: Fraction of simulations yielding insignificant effect
Simulation Study Overview Create true data Sample from historical baseline QT data Choose models and parameters for study design, PK, PD Add baseline response to simulated response to treatment Sample true data according to study design Estimate response Metrics in Concept Paper, in submissions Repeat “many” times at given set of study design parameters Compute Performance Power: Fraction of simulations yielding insignificant effect
Simulation Study Overview Create true data Sample from historical baseline QT data Choose models and parameters for study design, PK, PD Add baseline response to simulated response to treatment Sample true data according to study design Estimate response Metrics in Concept Paper, in submissions Repeat “many” times at given set of study design parameters Compute Performance Power: Fraction of simulations yielding insignificant effect
Step 1(a): Create True Data (Sample Baseline) 1. Randomly pick a subject from the database 2. Randomly pick a day of subject i’s baseline observations Day 4 3. Randomly pick n baseline observations / time point
Step 1 (b): Choose Simulation Conditions • 4 treatments evaluated: 2 doses of drug, placebo, active control • Parameters to be varied 1. Crossover vs. parallel design 2. Single dose vs. steady state design 3. N 4. ECG sampling • Timing • # replicate ECGs (n): at baseline, on treatment • # days of measurement: at baseline, on treatment 5. PK/PD model for drug • Delayed or direct response • EC50; parent, metabolite 6. PK model for drug • CL; parent, metabolite • ka
Treatment effect Drug QTc QTc QTc + = Time Time Time Placebo QTc QTc QTc = + Time Time Time Step 1 (c): Simulate Drug Response Treatment response Baseline QTc
True Treatment response Baseline QTc QTc Drug QTc QTc Drug Drug QTc Time Time Time Time QTc Placebo QTc QTc Placebo Placebo QTc Time Time Time Time Step 2: Sample According to Study Design e.g. Sampled Response e.g. Sampled Baseline
e.g. Sampled Response e.g. Sampled Baseline Estimated Treatment Effect QTc QTc Drug Time Time - = QTc QTc Placebo Time Time - = Step 3: Estimate Response Examples of approaches to estimating treatment effect Mean(sampled response): treatment - baseline Max(sampled response): treatment - baseline # Subjects with outlying values: treatment - baseline
Step 4: Repeat Many Times Randomly pick baseline data ↓ Simulate response to treatment ↓ Estimate drug effect DQTcF Study 1 5 msec Study 2 8 msec … Study 1000 2 msec
Step 5: Evaluate Performance e.g. Power Fraction of simulations in which Ho rejected Ho: mean change from baseline for drug = placebo
Study Results: 200 clinical trials simulated QT baseline source data Resample from 72 hr QTc data in 45 subjects Individual Trial Design Randomized, parallel, with treatment and placebo arms 24 hour placebo run in; 24 hours on treatment Hourly QT sampling from 1-24 hours N: varied Treatment characteristics p.o. administration Dose = 100 mg PK: One compartment; ka: 1/hr, CL: 25 L/hr, V: 400 L, Tmax: 2-5 hours PK/PD: Linear relationship, no effect delay Drug effect on QTc is additive on top of the baseline variation Intersubject variability of PK and PK/PD are 25% Analysis 24-hr max QTc during treatment – 24-hr max QTc for baseline 24-hr mean QTc during treatment – 24-hr mean QTc for baseline 24-hr max QTc during treatment – 24-hr average QTc during baseline 24-hr max QTc during treatment (no baseline subtraction)
Tmax: 2-5 hours log (Conc ng / mL)) Time (hr) Rmax ~ 16 msec DQTc from Baseline (msec) Time (hr) Treatment Characteristics
Power to Detect a Difference Between Drug and Placebo with 95% Confidence
Effect of Baseline Measurement on Power Several QT samples at baseline One QT sample at baseline
Questions for the committee 1. What additional study design points are recommended for consideration in the analysis of PK-QT data? 2. Comment on the case studies presented and the pros and cons of using clinical trial simulation approaches to evaluate PK-QT study design. Are there other methods of analyzing PK-QT data that the FDA should consider? 3. What critical design elements influence the outcome of a PK-QT study that has as its goal to identify a meaningful change in QT?